- Tools and Utilities
The SDK includes a number of tools and utilities that help diagnose issues involving the SDK and AJA devices.
These all operate the same on all three supported platforms (Linux, MacOS and Windows) and live in the top-level bin folder.
- “NTV2Watcher” – A handy debugging utility that shows the inner workings of NTV2 devices.
- “AJA Logger” — A handy viewer for displaying and/or recording messages from the AJADebug facility.
- “AJA System Test” – Measures the DMA performance of any AJA device attached to the host, as well as the read/write performance of local host storage.
- Data Rate Calculator calculates DMA performance requirements for various video and pixel formats. It's now universally available for mobile devices:
- ‘supportlog’ Command-Line Utility – Sometimes when diagnosing an issue, AJA’s OEM SDK support staff may request a “register dump” or “register log”. This log file can be generated using ‘supportlog’ Command-Line Utility or “NTV2Watcher”. See the Knowledgebase article How to Generate a ‘Support Log’ for more information.
- ntv2firmwareinstaller – A command-line tool used to “flash” new firmware into a connected AJA device. See the Knowledgebase article NTV2 Firmware Installer Command-Line Utility for details. This tool is included because AJA developers or their customers need to be able to program new firmware on an AJA device, and may not need or have access to the AJA retail services, including the AJA ControlPanel, which is commonly used to perform this task.
- Note
- The Corvid HEVC requires a somewhat different procedure for checking and updating its firmware. See The Corvid HEVC Supplement for more information.
- ntv2konaipj2ksetup – A command-line tool used to configure the KONA IP from a JSON configuration file.
- ntv2konaipjsonsetup – A command-line tool used to configure the KONA IP from a JSON configuration file.
- ‘logreader’ Command-Line Utility — A command-line tool that prints messages from the AJADebug facility.
- ‘logjammer’ Command-Line Utility — A command-line tool that generates messages for the AJADebug facility.
- ‘ntv2thermo’ Command-Line Utility – Interrogates and/or controls temperature-related parameters of connected AJA devices.
‘ntv2thermo’ Command-Line Utility
- Description
A command-line tool that interrogates and/or controls temperature-related parameters of connected AJA devices.
- Synopsis
ntv2thermo [OPTION...]
-d, --device=index#|serial#|model device to use
-f, --format=brief|verbose|json desired format
-s, --scale=celsius|fahrenheit desired scale
--fan=read|off|on|lo|med|hi|auto desired fan setting
--version show version and exit
Help options:
-?, --help Show this help message
--usage Show brief usage message
- Anything specified after a command line option switch is case insensitive (e.g.,
cElSiUs == Celsius).
- If you have more than one device attached to your host, use the
-d switch to pick one of them. You can specify a zero-based index number, the serial number of a specific device, or a model name (e.g., io4k).
- Use the
–format option to specify the output format: brief (minimal), verbose (english sentence), or json (something a computer would appreciate). JSON formats always include a date/time stamp (in local time), the device name, and the device index number … plus the requested fan state or temperature (and temperature units).
- Use the
–scale option to specify the temperature unit scale to use: celsius (or c, the default), fahrenheit (or f), kelvin (or k) or rankine (or r).
- Use the
–fan option to inquire about or control the fan. Follow it with read to report the current fan state, on to turn it on, or off to turn it off. Use auto to enable automatic fan control (assuming the device and/or driver supports it).
- Note
- On devices for which automatic fan control is supported, using on, off, lo, med, or hi will override and disable the automatic fan control.
- Warning
- CAUTION! Turning the fan “off” or disabling a device’s automatic fan control can cause the device to overheat, and result in permanent damage to the device!
- Temperature Measurement
To read the temperature:
$ ./bin/ntv2thermo -b1
'Io4K - 1' die temperature is 72.8406 degrees Celsius
Note that it defaults to verbose format and Celsius units. To show just the numeric temperature reading in Fahrenheit:
$ ./bin/ntv2thermo -b1 -s=fahrenheit -f=brief
161.341
To output the temperature in the Rankine scale in JSON format:
$ ./bin/ntv2thermo -b1 -s=rankine -f=json
{"timestamp": "Wed Oct 21 12:18:53 2015", "name": "Io4K - 1", "deviceIndex": 1, "temperature": 621.011, "temperatureScale": "rankine"}
To show the temperature in Kelvin:
$ ./bin/ntv2thermo --device io4k --scale kelvin
'Io4K - 1' die temperature is 344.514 degrees Kelvin
- Logging
By specifying the –log command line switch, the tool enters “logging” mode, which periodically writes temperature and fan state until interrupted (using Ctrl-C). The argument to the –log switch is an unsigned decimal integer that specifies the number of seconds between each line in the report:
$ ./bin/ntv2thermo --device io4k --log 5 --scale=f -f=json
{"timestamp": "Wed Oct 21 12:14:32 2015", "name": "Io4K - 2",
"deviceIndex": 2, "temperature": 173.744, "temperatureScale": "f"}
{"timestamp": "Wed Oct 21 12:14:37 2015", "name": "Io4K - 2",
"deviceIndex": 2, "temperature": 172.858, "temperatureScale": "f"}
{"timestamp": "Wed Oct 21 12:14:42 2015", "name": "Io4K - 2",
"deviceIndex": 2, "temperature": 172.858, "temperatureScale": "f"}
^C
- “Fan” Mode
By specifying the –fan command line switch, the tool enters “fan” mode, which overrides its temperature measurement functionality.
- Note
- Fan mode is only supported on devices that have adjustable fans — see NTV2DeviceCanThermostat.
To show the fan status:
$ ./bin/ntv2thermo --device io4k --fan read
'Io4K - 1' fan is ON
To output the fan status as a number:
$ ./bin/ntv2thermo --device io4k --fan read --format brief
1
To output the fan status in JSON:
$ ./bin/ntv2thermo --device io4k --fan read --format json
{"name": "Io4K - 1", "deviceIndex": 1, "fanIsOn": true}
To turn on the fan:
$ ./bin/ntv2thermo --device io4k --fan on
Fan turned ON on 'Io4K - 1'
To turn off the fan with minimal output:
$ ./bin/ntv2thermo --device io4k --fan off -f b
0
It’s not an error to turn on the fan when it’s already on, nor is it an error to turn off the fan when it’s already off.
JSON output is not supported when turning the fan on or off.
- Exit Codes
- 0 — Success. No errors encountered. The tool did what it was asked to do.
- 1 — An illegal command line parameter was specified.
- 2 — No such device (e.g., specifying
-b io4k when there’s no Io4K attached).
- 3 — The tool failed to successfully communicate with the device driver, or an API call failed.
- Output File Streams
- stdout — Normal output (e.g., brief, verbose or JSON output) is directed to this stream.
- stderr — Warning and error messages are directed to this stream, usually followed by the tool exiting with a non-zero exit code.
“AJA Logger”
This page describes how to use the AJA Logger utility to monitor AJA software.
- Note
- This application is deprecated and will be removed in a future SDK. Please use the “AJADebug Log” Tool in “NTV2Watcher”.
The AJA Logger application allows you to monitor, in near real time, log messages originated by the AJADebug facility. It has several handy features:
- Filtering based on message content.
- Filter based on message classification and/or severity.
- Colorize messages based on originating process ID.
- Calculate time between two messages.
- Log recording, snapshotting, copying (clipboard) and printing.
- Non-AJA software can contribute messages from the logjammer tool.
- General Operation
TheAJA Logger’s user interface consists of one main window, the main window having three parts:
AJA Logger Operation
The Main View shows log messages in tabular fashion, one log entry per table row, with the log entry data shown in columns. The tool bar at the top has the following controls:
- Message Groups…: Click to open the configuration dialog box. See Enable/Disable Message Groups Dialog for details.
- Log to File: Enables or disables recording incoming messages to a log file.
- Save As…: Saves the contents of the message display to a file of the user’s choosing.
- Font…: Opens a font dialog to change the font and size of the log display.
- Clear: Erases all captured messages from the log display.
- AutoScroll: Enables or disables the auto-scrolling feature.
- Pause: Pauses or resumes the capture/display of new messages.
- Add Marker: Inserts a marker into the log.
- Auto Group: Specifies a “quiet time”, in seconds, that if no messages are logged in that interval, the first that arrives after it transpires will automatically be preceded by a marker entry.
- Message Filter: If non-empty, filters the log display such that it will only show messages containing the filter text.
The data columns are as follows:
- Index: The unique index number of the message. This number starts at zero when the AJA Debug Facility is initialized.
- PID: The ID of the message’s originating host process.
- TID: The ID of the message’s originating host thread.
- Time: The host timestamp when the message entered the AJA Debug Facility’s ring buffer.
- Group: The message’s classification group (see AJADebugUnit).
- Severity: The message’s severity (see AJADebugSeverity).
- Source: The message’s originating source file name and line number (if known).
- Message: The log message text.
By default, all columns are visible. If needed, any of the columns (except for Message) can be hidden.
- To hide a column, uncheck it in the View menu’s Column sub-menu.
- To re-show a column, check it.
- To quickly re-show all columns, choose the Show All Columns command in the Column submenu in the View menu.
Messages are always displayed in increasing index/time order, top-to-bottom.
The Status Bar shows:
- File Recording State: If the logger’s “Log” setting is enabled, it shows the path of the log file being written, and its size, in bytes. If the logger’s “Log” setting is off, it shows “not logging to file”.
- Message Stats:
- Ignored: The number of messages that were reported by AJADebug clients, but ignored by the AJA Logger. You can choose the kinds of messages to ignore by showing the Enables dialog box by clicking the Enables button. You can also pause the logger by clicking the Pause button.
- Accepted: The number of messages that were reported by AJADebug clients, and accepted for display by the AJA Logger application.
- Total: The total number of messages that were reported by AJADebug clients.
- Ref Count: The number of attached clients that are currently monitoring AJADebug activity.
As new messages are reported to the AJADebug logging facility, these are detected and, if configured to show them, incorporated into the log display.
If the AutoScroll button is highlighted, the display will auto-scroll to the bottom, to continually show the newest message. Otherwise, the Main View remains at its current scroll position.
- Note
- Log messages containing line breaks (newline characters) are displayed in a single row, with the message text truncated at the first line break in the message. If logging to a file is enabled, the message text is written to the log file unchanged (including line breaks).
- Selecting and Copying Data
Clicking inside the Main View highlights (selects) information on a per-messsage (row) basis.
The usual rules of selection are followed:
- “Shift-click” — Extends the selection.
- “Ctrl-click” or “Command-click” — Extends or contracts the selection.
- “Dragging” — Continues to extend (or contract) the selection while the mouse button is down (and auto-scrolls, too).
An Edit menu is provided for standard data copying commands:
- Copy — Copies the highlighted (selected) information to the clipboard. The copied text will have the same line and field delimiters used for file logging (see below).
- The standard “Ctrl-C” or “Command-C” shortcuts also can be used.
- Right-clicking inside the highlighted messages brings up a context menu:
- Choose Copy to copy the highlighted information to the clipboard.
- Clear — Erases all captured messages from the display.
- Select All — Highlights all captured messages in the display.
- Logging to a File
When the Log to File button in the Toolbar is highlighted, or the Log to File command in the Action menu is checked, incoming messages are automatically recorded into a file on the host.
- The path to the file (and its current size, in bytes) is displayed in the Status Bar, on the left side.
- The file is written in clear text, in UTF-8 encoding, one line per message.
- The line delimiter used is native to the host operating system.
- The delimiter between fields (Index, PID, TID, Time, Group, etc.) is user-selectable, and defaults to the semicolon (“;”).
- To change it, click in the View menu, choose Text Delimiter, then choose the desired delimiter.
- Subsequent writes to the file will use the new delimiter.
- Log messages that contain line breaks in the message text are written into the log file without change.
To toggle file logging on or off, click the Log to File button in the Toolbar, or un-check its command in the Action menu.
- Clearing the Log Display
To clear the log display, do one of the following:
- click the Clear button in the Toolbar;
- choose Clear from the Edit menu;
- or press the forward-delete key.
- Pausing or Resuming the Log Display
When the Pause button in the Toolbar is highlighted, incoming messages are no longer captured. They are, however, are still recorded in the log file (if file logging is enabled).
To toggle the log display, click the Pause button in the Toolbar.
- Inserting Markers Into the Log
An “elapsed time” marker is automatically inserted into the log when a new log message is captured by AJA Logger after a user-configurable number of seconds has passed since the last accepted message was received. The default time interval is 86400 seconds (one day). To change this automatic marker-insertion delay, type a new value, in seconds, into the Auto Group edit box in the Toolbar … then press Return, Enter or Tab.
To manually insert a marker into the log, click the Add Marker button in the Toolbar. It will be timestamped and appended to the log.
- Changing the Display Font/Typeface
To change the typeface used in the log display, click the Font… button in the Toolbar or the Font… command in the View menu. The host-specific Font-chooser dialog box will appear. Choose the font family, size and style, then click OK. The Main View will be redrawn using the new typeface.
- Changing the Message Color Based on Process ID
AJA Logger can display messages having the same process ID (PID) with any background color you choose. This makes it very easy to differentiate messages coming from different processes on the host computer.
- Right-click on the message(s) having the desired process ID you wish to colorize.
- Choose Set row color for PID….
- A color picker dialog will appear. Choose the new desired background color, then click OK.
All messages having that process ID will be drawn with the chosen background color.
- Resizing Columns
AJA Logger can automatically adjust the width of its columns based on the longest data in the column. When the Automatically Resize Columns item in the View menu is checked, AJA Logger will automatically resize columns based on the messages it’s captured for display. If the item is unchecked, column widths are fixed. Choose the Automatically Resize Columns item to toggle its setting.
To manually resize a column, click on the column’s border in the column heading, and drag.
- Filtering Displayed Messages
To see only those messages that contain a particular character string, enter the search text into the Message Filter edit box in the Toolbar … then press Return, Enter or Tab. Henceforth, you’ll only see messages that contain that text — all others will be excluded and invisible.
- Note
- This will only affect messages received by AJA Logger after changing the Message Filter text.
To stop filtering displayed messages, delete all text from the Message Filter edit box … then press Return, Enter or Tab.
- Measuring the Time Between Two Messages
To measure the time span between two messages in the display:
- Turn off AutoScroll. This makes it easier to select the desired message.
- Scroll to reveal the first message, then (left) click on it.
- Scroll to reveal the second message, then Command-Click (MacOS) or Control-Click on it.
- Right-click on either of the two highlighted messages.
- Note the elapsed time is the first item in the popup menu.
- AJA Debug System Information
Choose “About AJALogger” from the “Help” menu (Windows and Linux) or the “AJA Logger” menu (MacOS). Scroll down to view the AJA Debug facility version and its other technical details.
Enable/Disable Message Groups Dialog
The AJA Logger has powerful filtering capabilities that make it easy to “include everything except…” or “exclude everything but…” or a combination.
To reveal the Enable/Disable Message Groups dialog box, click the Message Groups… button in the Toolbar, or choose the Message Groups… command from the View menu.
The dialog box has two sections:
- Groups — Enable or disable message display by group (aka AJADebugUnit).
- Severity — Enable or disable message display by severity (aka AJADebugSeverity).
Each checkbox is “live” — i.e. toggling a checkbox takes effect immediately.
There are handy pushbuttons for immediately enabling or disabling all of the Group or Severity checkboxes.
Click OK to dismiss (hide) the dialog box.
How to Post Messages
SDK clients can post their own messages with the AJADebug facility.
- In your source file(s),
#include "ajadebug.h" .
- Be sure to link with the libajantv2 library.
- When the application starts, call AJADebug::Open.
- Call AJADebug::Report to log a message … or use one of the AJA_sDEBUG, AJA_sINFO, AJA_sNOTICE, etc. macros.
“HEVC Monitor”
The NTV2 HEVC Monitor is a development tool that provides setup, control and state information for the Corvid HEVC codec board, which is a standard NTV2 video video ingest board coupled with an HEVC hardware codec. The NTV2 driver controls both the NTV2 components and the HEVC codec.
The HEVC Monitor is a window into the NTV2 driver which tracks the hardware state and video transfer queues to and from the codec.
The normal NTV2 component state can be monitored using the standard Watcher and Cables applications.
The HEVC Monitor is a Qt application with a tabbed presentation. The layout of the interface is tightly coupled to the codec hardware and control architecture. The HEVC codec provides encoding setup registers and 3 transaction interfaces to control state and transfer video data.
The top line of the HEVC monitor contains a board selector and reset button. The reset button will reset the codec hardware and all driver control logic and queues. It should only be used when the codec is idle or has reached an irrecoverable error state. The result of a reset during codec operation will be random! The "Control" tab provides access to the codec command interface and encoding setup parameters. The "Stream" tab monitors the codec DMA interfaces and maintains statistics for the driver queues that stream data. The "Debug" tab provides driver and firmware revision information and can enable/disable driver debug output to the system log file.
Control Tab
The HEVC monitor control tab provides access to the codec command interface and encoding setup parameters.
The Codec Commands interface allows the user to send state change commands to the codec. The desired state is selected for the main, video input and encoder streams using the drop down boxes. The send buttons sends the request to the codec. The stream check boxes determine which streams receive the stream state commands. There is no filtering of the commands to insure the codec remains in an operational state. See the codec documentation for detailed descriptions of the codec state machine.
The Codec State data is the current state of the codec state machine. The main state will indicate Boot after a codec reset. The Init state indicates that the codec is ready to receive encode parameters. The Encode state indicates the codec is ready to encode. The encode mode can be Single or Multiple which controls how many streams the codec can encode. The Vin and Eh states can be Stop or Start. In the Stop state the encoder can be reconfigured using the codec parameters interface. In the Start state the codec is ready to encode video frames.
The Codec Command Queue information displays the current state of the NTV2 driver command queue. It contains the current count of the commands issued to the codec between resets and the current command queue level.
The Codec Parameters interface can load and dump codec encoding parameters. The binary directory is used to specify a directory containing the binary parameter files provided by the codec vendor. The codec parameters can also be saved and loaded from a single text file. The file is formatted as simple 32-bit address/value pairs that can be viewed with a text editor and compared using standard text file comparison applications. This can be useful in debugging encoder settings. There is also a parameter peek/poke interface to allow examining and changing individual parameter registers.
Stream Tab
The Stream tab monitors the codec DMA interfaces and maintains statistics for the driver queues that stream data.
The Codec DMA Queue interface displays the current state of the NTV2 driver codec queues. There is a raw video queue and a compressed HEVC queue. The transfer count is the number of DMA transfers operations completed by each queue. The queue level is the current number of transfers in the driver queue. The DMA submit value is the current number of DMA transfers issued to the codec. The DMA Ack value is the current number of acknowledge interrupts received from the codec. The DMA Msg value is the current number of DMA completion message interrupts received from the codec. For more information concerning the codec transactions see the codec documentation.
The Codec Stream Statistics contains counts and timing information for each of the codec streams. Sizes are displayed in bytes, time in microseconds and data rates in kilobytes per second.
- Transfer Count — The number of transfers completed for this stream.
- Avr Transfer Time — The average time between transfers.
- Min Transfer Size — The minimum size of a video transfer.
- Avr Transfer Size — The average size of a video transfer.
- Max Transfer Size — The maximum size of a video transfer.
- Min Copy Duration — The minimum duration of a video frame bounce buffer copy. This is the software time required to copy the video frame.
- Avr Copy Duration — The average duration of a video frame bounce buffer copy. This is the software time required to copy the video frame.
- Max Copy Duration — The maximum duration of a video frame bounce buffer copy. This is the software time required to copy the video frame.
- Min Enqueue Duration — The minimum time between adding a DMA transfer to the queue and sending the DMA request to the codec.
- Avr Enqueue Duration — The average time between adding a DMA transfer to the queue and sending the DMA request to the codec.
- Max Enqueue Duration — The maximum time between adding a DMA transfer to the queue and sending the DMA request to the codec.
- Min Send Duration — The minimum, average and maximum time between sending a DMA request to the codec and the acknowledge interrupt from the codec.
- Avr Send Duration — The minimum, average and maximum time between sending a DMA request to the codec and the acknowledge interrupt from the codec.
- Max Send Duration — The minimum, average and maximum time between sending a DMA request to the codec and the acknowledge interrupt from the codec.
- Min DMA Duration — The minimum time between the codec acknowledge interrupt and completion message interrupt. This is the hardware time required for the DMA transfer.
- Avr DMA Duration — The average time between the codec acknowledge interrupt and completion message interrupt. This is the hardware time required for the DMA transfer.
- Max DMA Duration — The maximum time between the codec acknowledge interrupt and completion message interrupt. This is the hardware time required for the DMA transfer.
- Min Dequeue Duration — The minimum time between the adding a transfer to the DMA queue and releasing the queue entry. This is the software time required for the DMA transfer.
- Avr Dequeue Duration — The average time between the adding a transfer to the DMA queue and releasing the queue entry. This is the software time required for the DMA transfer.
- Max Dequeue Duration — The maximum time between the adding a transfer to the DMA queue and releasing the queue entry. This is the software time required for the DMA transfer.
- Avr Total Duration — The total software time required for the video transfer.
- Avr DMA Rate — The average hardware DMA data rate.
- Avr Data Rate — The average stream data rate.
The DMA duration of the HEVC stream does not reflect the actual hardware DMA time. It appears the codec stalls this DMA operation until a frame is available. This also affects the calculation of the HEVC stream DMA rate.
There is a Reset Statistics button that can be used to restart the statistics tracking at any time.
Debug Tab
The Debug tab provides driver and firmware revision information and can enable/disable driver debug output to the system log file.
The Driver Debug Output check boxes enable various debug messages from the NTV2 driver. The messages are written to the system driver debug output log. In linux, messages can be monitored using:
$ sudo tail –f /var/log/syslog
In Windows, use the dbgview application from the Microsoft Technet website.
Driver debug messages can be very useful in debugging all types of software and hardware issues. The driver debug information is categorized into several subsystems. The info messages are usually one per driver call for monitoring how the driver is being driven by the application or the operating system. The state messages contain more detail on how the driver performs operations. The error messages are warnings and errors that usually require developer attention.
The initial info, warning and error information relates mostly to driver loading and unloading. The interrupt category messages are reported from the interrupt routines. The command, vei (raw video) and seo (encodec video) information relate to the interrupt driver requests to the codec. The register category will log all codec register access. The command and stream categories are for monitoring the codec command and streaming transfer operations. The DMA category messages detail the setup of the DMA registers. There are also categories for bounce buffer allocation and driver status information requests.
The debug tab also contains version information for the NTV2 codec driver and internal codec software and firmware.
‘logjammer’ Command-Line Utility
- Description
A command-line tool that generates AJADebug log messages.
- Synopsis
logjammer [OPTION...]
-i, --index=0 thru 84 Message group to use (defaults to 4)
-s, --severity=deb|inf|not|warn|err|... Message severity to use (defaults to Debug)
-r, --rate=messages per second Message log rate (robotic mode)
Help options:
-?, --help Show this help message
--usage Show brief usage message
- Generating Messages
By default, logjammer posts one message per line read from standard input, using the message group UserGeneric (4) and Debug severity.
For example, on a Unix-type operating system, this will copy log messages from a web server into the AJADebug facility:
$ tail -f /var/log/apache2/httpd.log | ./bin/logjammer
Use the –index (-i) parameter to specify the message group for all generated messages. For example…
Use the –severity (-s) parameter to specify the severity for all generated messages. For example…
$ ./bin/logjammer --severity inf
- Robotic Mode
This mode generates messages automatically at a specified rate. When in this mode, standard input is not read.
The –rate (-r) parameter is used for this mode. It expects a single, non-zero, unsigned decimal value to specify the number of messages to generate every second.
‘logreader’ Command-Line Utility
- Description
A command-line tool that streams AJADebug log messages to standard output (or standard error).
- Synopsis
logreader [OPTION...]
-u, --unit=[*|?]{{+|-}{0-84}}[...] debug unit filter
-s, --severity=[*|?]{{+|-}{deb|inf|not|warn|err}}[...] severity level filter
--pid=process ID process ID filter
--tid=thread ID thread ID filter
-t, --threshold=deb|inf|not|warn|err|assert|alert|emerg stderr severity threshold
--setdu set debug units
--stats show active stats, then exit
-v --verbose show extra information when starting
-V, --version shows debug facility version
Help options:
-?, --help Show this help message
--usage Show brief usage message
- The executable is shipped pre-built with the SDK, and appears in the “bin” directory.
- Source code is provided in the SDK.
- Filtering by Message Severity
By default, logreader reports all messages regardless of message severity. Each severity can be specified by a severity identifier (which correspond to the AJADebugSeverity enumeration values):
- Emergency (or 0)
- Alert (or 1)
- Assert (or 2)
- Error (or 3)
- Warning (or 4)
- Notice (or 5)
- Info (or 6)
- Debug (or 7)
The –severity or -s option allows you to specify which severities to display.
The parameter value is a sequence of severity identifiers that each are preceded by:
- + (to include), or…
- - (to exclude).
The parameter value can also start with * (an asterisk) to mean “all” severities.
A ? (question mark) placed anywhere in the parameter will display a help message and terminate the tool:
$ ./bin/logreader -s"?"
## Legal severity values: debug|info|notice|warning|error|assert|alert|emergency
## Precede with '+' to include, or '-' to exclude; start with '*' to specify 'everything'
## EXAMPLE: --severity="*-debug-info" Show all except Debug and Info messages
## EXAMPLE: --severity=+notice+warn Show only Notice and Warning messages
Order and case is irrelevant, and identifiers can be repeated. They’re parsed left-to-right, so the right-most specification “wins”. They can also be abbreviated to the smallest number of letters that uniquely identify it.
To display all messages, regardless of severity, omit the -s parameter, or use this:
To display all messages except those having Debug or Info severities, use the “all except” form:
$ ./bin/logreader --severity "*-debug-info"
To display only Notice or Warning severities:
$ ./bin/logreader -s+not+warn
$ ./bin/logreader -s+5+4
$ ./bin/logreader -s+debug+info+notice+warning+error+assert+alert+emergency-alert-emergency-assert-error-info-debug
- Filtering by Message Debug Unit (Groups)
By default, logreader reports all messages whose Debug Units are Enabled. These are the messages that are allowed to enter the global ring buffer on the host computer.
“AJA Logger” has a configuration dialog that allows you to choose which Debug Unit’s messages to allow into the buffer (see logger-config ).
Each Debug Unit can be specified by a Debug Unit identifier (which correspond to the AJADebugUnit enumeration values):
- Unknown (or 0)
- Critical (or 1)
- DriverGeneric (or 2)
- ServiceGeneric (or 3)
- UserGeneric (or 4)
- VideoGeneric (or 5)
- AudioGeneric (or 6)
- TimecodeGeneric (or 7)
- AncGeneric (or 8)
- RoutingGeneric (or 9)
- StatsGeneric (or 10)
- Enumeration (or 11)
- Application (or 12)
- QuickTime (or 13)
- ControlPanel (or 14)
- Watcher (or 15)
- Plugins (or 16)
- CCLine21Decode (or 17)
- CCLine21Encode (or 18)
- CC608DataQueue (or 19)
- CC608MsgQueue (or 20)
- CC608Decode (or 21)
- CC608DecodeChannel (or 22)
- CC608DecodeScreen (or 23)
- CC608Encode (or 24)
- CC708Decode (or 25)
- CC708Service (or 26)
- CC708ServiceBlockQueue (or 27)
- CC708Window (or 28)
- CC708Encode (or 29)
- CCFont (or 30)
- SMPTEAnc (or 31)
- AJAAncData (or 32)
- AJAAncList (or 33)
- BFT (or 34)
- PnP (or 35)
- Persistence (or 36)
- Avid (or 37)
- DriverInterface (or 38)
- AutoCirculate (or 39)
- NMOS (or 40)
- App_DiskRead (or 41)
- App_DiskWrite (or 42)
- App_Decode (or 43)
- App_Encode (or 44)
- App_DMA (or 45)
- App_Screen (or 46)
- App_User1 (or 47)
- App_User2 (or 48)
- Anc2110Xmit (or 49)
- Anc2110Rcv (or 50)
- DemoPlayout (or 51)
- DemoCapture (or 52)
- CSC (or 53)
- LUT (or 54)
- Cables (or 55)
- …plus the “unused” set 56 thru 84
The –unit or -u option allows you to specify which Debug Unit(s) to display.
The parameter value is a sequence of Debug Unit identifiers that each must be preceded by:
- + (to include), or…
- - (to exclude).
The parameter value can also start with * (an asterisk) to mean “all” Debug Units.
A ? (question mark) placed anywhere in the parameter will display a help message and terminate the tool:
$ ./bin/logreader -u"?"
## Legal debug units: Unknown|Critical|DriverGeneric|ServiceGeneric|UserGeneric|VideoGeneric|AudioGeneric|…
## Precede with '+' to include, or '-' to exclude; start with '*' to specify 'everything'
## EXAMPLE: -u"*-AncGeneric-CC608Decode" Show all except AncGeneric & CC608Decode messages
## EXAMPLE: -u+DriverInterface+AutoCirculate Show only DriverInterface & AutoCirculate messages
Order and case is irrelevant, and identifiers can be repeated. They’re parsed left-to-right, so the right-most specification “wins”. They can also be abbreviated to the smallest number of letters that uniquely identify it.
To display all messages, regardless of Debug Unit, omit the -u parameter, or use this:
To display all messages except those in the AncGeneric and CC608Decode groups, use the “all except” form:
$ ./bin/logreader --unit "*-AncGeneric-CC608Decode"
To display only messages from the DriverInterface and AutoCirculate groups:
$ ./bin/logreader -u+driverint+autocirc
$ ./bin/logreader -u+38+39
$ ./bin/logreader -u+39+driverint
Use the –enable option to forcibly Enable the specified Debug Units and permit messages of those groups to enter the global ring buffer on the host computer. For example, to Enable (and also monitor) only messages from the DriverInterface and AutoCirculate groups:
$ ./bin/logreader --enable --unit +DriverInterface+AutoCirculate -v
## NOTE: Filtering: Showing 2 debug unit(s): +DriverInterface+AutoCirculate
## NOTE: Selected debug unit(s) AJADebug::Enable'd -- all others AJADebug::Disable'd
- Note
- Using the –enable option will affect what’s displayed in all running instances of “AJA Logger” and logreader.
- Logging to Files
Use the host operating system’s own output redirection facility to stream logreader’s output to a file.
$ ./bin/logreader >/home/bozo/logfile.txt
By default, all logreader output is streamed to the standard output stream.
Use the –threshold or -t option to split the message output into two different streams based on the message’s severity.
To route all messages of severity Info and below into file “debuginfo.txt” and all other messages into another file “errors.txt”:
$ ./bin/logreader --threshold Info 2>debuginfo.txt >errors.txt
## NOTE: Messages higher than severity 'info' will be written to stderr; all others to stdout
- Custom Formatting
By default, logreader writes the following information fields to the output stream, each field delimited by a single horizontal tab character (ASCII 0x08), and each message delimited by the default platform-specific “newline” character (≺CR≻≺LF≻ on Windows, and ≺LF≻ on Mac and Linux):
- Message Index Number (unsigned decimal number)
- Process ID (unsigned decimal number)
- Thread ID (unsigned decimal number)
- Time Stamp (unsigned floating point number)
- Debug Unit (string/name)
- Severity (string/name)
- Source File (full path, string)
- Source Line Number (unsigned decimal number)
- Message Text (string)
- Note
- Some messages incorporate multiple lines of text, each line separated by the “newline” character(s) appropriate for the platform that produced the message.
This default output can be customized to some extent using the –format or -f option. Its parameter value is a character string that can contain escape sequences that get replaced with message field data.
The valid escape sequences are as follows:
- I Message Index Number
- p Process ID
- t Thread ID
- T Time Stamp
- D Debug unit
- S Severity
- P Full source file path
- F Source folder path (part of full source file path)
- N Source file name (part of full source file path, includes extension)
- n Source file base name (part of source file name, excludes extension)
- x Source file name extension (part of file name)
- L Source file line number
- M Message text
- %% Percent sign
Line Feed (0x0A )- \f Form Feed (
0x0C )
- \r Carriage Return (
0x0D )
- \ Backslash (
0x5C )
- Bell (
0x07 )
- Backspace (
0x08 )
- \t Horizontal Tab (
0x09 )
- \v Vertical Tab (
0x0B )
- Note
- When using custom formatting, logreader does not emit a line break after each message. If you need a line break after each message (or before each message), be sure to put one into the parameter string (e.g.
"%T\t%M\n" ).
Example: To emit the default output, omit the –format or -f option, or do this:
$ ./bin/logreader --format "%I\t%p\t%t\t%T\t%D\t%S\t%P\t%L\t%M\n"
Example: To emit the default output, but use a Comma instead of a Horizontal Tab character as the field delimiter:
$ ./bin/logreader --format "%I,%p,%t,%T,%D,%S,%P,%L,%M\n"
“NTV2Watcher”
This page describes how to use the NTV2 Watcher tool to interactively monitor and control an AJA device.
General Operation
- Device Selection
- Common Settings
- Inspectors
- Global Settings
Tool Windows:
General Operation
The NTV2 Watcher is a graphical tool that interactively monitors and configures an NTV2 device.
The user interface consists of a main window that contains these major elements:
- Common Device Controls — These Toolbars are common to all devices (and can be undocked, if desired):
- Device Selection Toolbar — for selecting which device to monitor/control;
- Common Controls Toolbar — for changing the poll rate, task mode, and other “global” aspects of the device.
- Inspector List — for selecting which aspect of the device to inspect and/or control;
- Inspector Display Area — the main data display area;
- Status Bar — which holds the status indicators:
- Status Message — Some inspectors will display messages here in certain situations.
- Selection Indicator — Some inspectors allow data portions to be selected interactively using the keyboard or mouse. This part of the Status Bar briefly describes the current selection.
- Endianness — Some inspectors display 2, 4, or 8-byte numbers. This indicator shows the current endianness of the data display as BE (“Big Endian”) or LE (“Little Endian”).
- It’s colored Green if it’s the native endianness for the host processor.
- It’s colored Yellow if it’s not native.
- Die Temperature — Indicates the instantaneous measured die temperature of the device’s FPGA.
- It’s colored Green if the temperature is at or below normal.
- It’s colored Yellow if the temperature is slightly above normal.
- It’s colored Red if the temperature is significantly above normal.
- Refresh Rate — Indicates the actual measured refresh rate of the main window’s active inspector (a moving average).
- The refresh rate of detached inspector windows is not measured.
- The indicator shows “N/A” when polling is disabled (i.e. when the Poll checkbox is not checked/ticked).
- The indicator is Green if the measured refresh rate is what’s expected:
- For inspectors tied to the VBI, it must be no more than the expected frame rate.
- For all other inspectors, it must be no greater than the polling Interval slider setting.
- It’s colored Yellow if the measured rate lags the expected rate by less than about 5%.
- It’s colored Red if the measured rate lags the expected rate by more than approximately 5%.
- Device Selection
A single instance of NTV2 Watcher monitors and/or controls one AJA device at a time. This panel provides a menu for choosing which AJA device the tool will focus on.
The top of the menu is populated with devices that are installed or attached directly to the host. It’s followed by the “Manage Other Devices…” command, which opens the Manage Devices tool window. The bottom section of the menu is populated with the Known Remote Devices (see below).
Choosing a different device in the menu causes NTV2Watcher to stop monitoring the previously-selected device, and starts monitoring the newly-selected one. Depending on the device and its capabilities, the list of available inspectors may change.
“Manage Devices” Window
This tool window is for…
- Remote Devices — to find remote devices on other hosts in your LAN to monitor and/or control:
- To add a remote device to the list of Known Remote Devices:
- Type its IP address or DNS name in the provided text box.
- If the remote “nub” uses a port number other than 7575, enter its port number in the Port: box.
- When NTV2Watcher is able to successfully communicate with the remote “nub”, the Add button will become enabled.
- Click Add to add the remote device to the Known Remote Devices list.
- To remove a remote device from the Known Remote Devices list:
- Right-click on the remote device to be removed.
- Choose the appropriate Remove command from the menu.
- Publish Devices — to publish a locally attached/installed host device (to allow other hosts to connect to it).
- This runs or stops a local “NTV2 Nub” server.
- Software Devices — to configure AJA “software” devices.
- Menu Commands
Here’s what’s in the menu bar:
- File Menu
- Edit Menu
- Cut — Disabled.
- Copy — Copies the currently highlighted/selected data, if any, to the host computer’s clipboard.
- Paste — Pastes the host computer’s clipboard contents into the current inspector’s data view, if possible.
- Clear — Deletes or zero’s the currently highlighted/selected data, if possible.
- Select All — Highlights/selects everything in the current inspector’s data view, if possible.
- View Menu
- Memory Map — Shows/Hides the “Memory Map” Tool.
- CEA608 Monitor — Shows/Hides the “EIA/CEA-608 Caption” Tool.
- Fill Buffers — Shows/Hides the “Fill Buffer” Tool.
- Register Cycler — Shows/Hides the “Register Cycler” Tool.
- Tone Generator — Shows/Hides the “Tone Generator” Tool.
- Scrap Buffer — Shows/Hides the “Scrap Buffer” Tool.
- SDK Demos — Shows/Hides the “SDK Demos” Tool.
- AJADebug Stats — Shows/Hides the “AJADebug Stats” Tool.
- AJADebug Log — Shows/Hides the “AJADebug Log” Tool.
- Register Name — (IP Device inspectors only) — Shows/Hides register names.
- Hex Reg Numbers — (IP Device inspectors only) — Toggles showing IP Device register numbers in hexadecimal or decimal.
- Register Address — (IP Device inspectors only) — Displays IP Device registers as a hexadecimal (BAR) address.
- Register Offset — (IP Device inspectors only) — Displays IP Device registers as a byte offset (from base address).
- Register Number — (IP Device inspectors only) — Displays IP Device registers as an index number (normally ¼ the byte offset).
- Register Number Offset — (IP Device inspectors only) — .
- Help Menu
- SDK Support Login — Opens your web browser to the AJA SDK Support site’s home/login page.
- Generate Support Log — Generates a “register log” (aka “support log”) file, which is essential for AJA SDK Support staff to diagnose issues and ascertain the state of the AJA device.
- Capture SDRAM Contents — Records the contents of device SDRAM into a “.raw” binary data file. This may be requested on rare occasion by AJA SDK Support staff in order to diagnose certain issues.
- SDK Documentation — Opens your web browser to the main page of the online SDK Documentation.
- NTV2Watcher User Guide — Opens your web browser to the online “NTV2Watcher” User Guide.
- Common Settings
There are several settings that are common to the device and apply to all inspectors:
- Poll — Indicates and controls automatic device polling.
- Check/tick the box to repeatedly poll the device, and automatically update all active/visible inspectors.
- When polling is enabled, the Polling Interval slider appears, while the Refresh button will disappear.
- Un-check/un-tick the box to “freeze” all active/visible inspectors.
- When polling is disabled, a Refresh button appears, while the Polling Interval slider will disappear.
- Refresh — Push this button to immediately update and refresh all active/visible inspectors.
- This control is visible only when polling is disabled. It’s hidden when polling is enabled.
- Interval — Adjusts the polling interval, from 25 milliseconds up to 2 seconds.
- This control is visible only when polling is enabled. It’s hidden when polling is disabled.
- The Frame Buffer Inspector and Ancillary Data Inspector are sync’d to an input/output/reference VBI, and ignore this setting when polling is enabled.
- Task Mode — Indicates the device’s current task mode, and allows it to be changed.
- Multi-Format Mode — Indicates the device’s “multi-format” mode, and allows it to be changed.
- Reference — Indicates the device’s current clock reference setting, and allows it to be changed.
- Inspectors
There are a number of inspectors shown in the list at the left side of the window, only one of which can be selected at any given time. This list may change if more capabilities are added to NTV2 Watcher in subsequent SDK releases.
Each inspector has its own particular user interface that’s designed to monitor and/or control a specific aspect of the AJA device.
Clicking on an inspector item in the list replaces the one that’s currently displayed in the main window to the newly-selected one. If the newly-selected inspector was previously in use for the current device, its state will be exactly as it was left. (Only when the device is changed does a new inspector get started in its default state.)
Right-clicking an inspector item in the list pops up a context menu
- “Move to Separate Window” — Opens or moves the inspector to a separate window. This permits multiple inspectors to be viewed simultaneously.
Double-clicking on an inspector item in the list does the same thing as choosing the “Move to Separate Window” context menu item.
- Note
- Having multiple inspectors open in separate windows increases NTV2 Watcher CPU utilization, and can significantly impact the DMA transfer budget of the device and the PCIe bus.
- Bug:
- NTV2Watcher keeps some persistent settings data in a local config file. If this file gets corrupted, it can cause NTV2Watcher to hang or crash upon startup. To work around this issue:
- Linux — Delete the ‘NTV2Watcher.conf’ file from your local app data folder ‘~/.config/aja’.
- Mac OS — Delete the ‘NTV2Watcher’ folder from your local app data (in ‘/Users/username/Library/Application Support/AJA’).
- Windows — Delete the ‘NTV2Watcher’ folder from your local app data (in ‘/Users/username/AppData/Local/aja’).
Frame Buffer Inspector
The Frame Buffer inspector displays the contents of frame buffer memory on the AJA device in the context of a FrameStore.
- Note
- Because this inspector reads (via DMA) the entire contents of a frame buffer at the selected channel’s frame rate, it can interfere with any currently running video application, particularly if the additional DMAs exceed the available device or host data transfer budget. Thus, this inspector is not immune from “Heisenbugs” in which the act of monitoring an AJA device affects it and the application(s) under test.
In the context of the selected Channel/FrameStore, this inspector…
- …reads (via DMA) the frame buffer into host memory.
- In Raw mode, or for planar pixel formats, it reads the entire 8MB/16MB/32MB/etc. buffer.
- All other views — Line, Component, Waveform, Image — it reads the frame buffer up to and including the last visible raster line.
- …attempts to refresh at the FrameStore’s current frame rate (as soon after the VBI as possible) when polling is enabled (i.e. when the Poll checkbox is checked/ticked).
- An indicator in the bottom-right corner of the main window’s status bar shows the actual, measured refresh rate.
- When the indicator’s color is not Green, then the inspector is not frame-accurate, and the data being displayed is stale.
- When polling is disabled, it will only update when the Refresh button is pressed.
- After each refresh, it compares the frame buffer contents to what was read the last time:
- The bottom left of the main window‘s status bar shows the number of raster lines that changed from the last frame (except Raw view).
- Changed data is highlighted with a brighter color (except Image view).
- Frame Differencing mode statically highlights the differences between the current frame and another frame.
Frame buffer memory content can be displayed in four different View Modes:
- Line — The full raster (including VANC lines, if any), line-by-line, in decimal or hex format, grouped by 1, 2, 4 or 8-byte chunks.
- Raw — The entire 8MB or 16MB buffer in fixed-length “lines”, grouped by 1, 2, 4 or 8-byte chunks. The line length is adjustable. By default, unless disabled, boundaries between raster lines are indicated with a blue marker. Regions and planes are indicated by color: green for audio, yellow for Ancillary data, etc.
- Component — The full raster (including VANC lines, if any), line-by-line, in component format, determined by the FrameStore’s frame buffer format, in hex or decimal.
- Waveform — The full raster (including VANC lines, if any), one-line-at-a-time, as a waveform, with the component waveforms overlaid on top of each other.
- Image — The visible raster, as an image.
- Frame/Buffer Controls
- FrameStore/Channel — Selects the FrameStore/Channel of interest.
- On/Off — Indicates if the FrameStore/Channel is enabled or not. It can be changed using this menu (if not in Auto mode and the device Task Mode is not Standard Tasks).
- Frame Size Indicator — This shows the discrete size of the frame … i.e. the location of the frame boundaries in device memory. This will be the “intrinsic” minimum size of 8MB or 16MB, whatever is the largest size required by all device FrameStores (determined by the hardware firmware), and multiplied by 4 or 8 for UHD/4K or UHD2/8K rasters, respectively.
- Auto — If checked, the frame number being monitored will automatically follow the input or output (depending on frame-store mode) “current frame” register, and the frame number spin control will be disabled. If this is unchecked, the frame number spin control will be available, and the frame being watched can be manually controlled. When unchecked, many other aspects of the device can be controlled (e.g., Mode, Geometry, Format, Size, etc.), including the ability to manually edit/change the buffer content.
- Frame Number spin control: When available, controls which frame to view. When unavailable, indicates the frame being viewed. Frame 0 is the first frame in device memory.
- Note that this Frame Number in combination with the indicated Frame Size (above) determines the region in device memory being displayed. The offset and length calculation of this region is done in the context of the currently selected FrameStore/Channel.
- For example, if FrameStores 1 and 3 on a KONA 5 are configured for UHD/2vuy, and FrameStore 2 is configured for 720p/2vuy…
- Each frame of FrameStores 1 and 3 is 32MB in length.
- Each frame of FrameStore 2 is 8MB in length.
- Therefore, frames 0, 1, 2 and 3 of FrameStore 2 would all lie inside frame 0 of FrameStores 1 and 3.
- Similarly, frames 4, 5, 6 and 7 of FrameStore 2 would all lie inside frame 1 of FrameStores 1 and 3.
- And so on…
- Note
- Even though the current frame’s contents may have been written in the context of another FrameStore/Channel (e.g. '2vuy'), this inspector displays the frame’s data in the context of its current FrameStore/Channel (e.g. 'v210'), and thus may appear completely wrong, especially as an Image View Mode.
- Device/Channel Configuration
- Mode — Indicates/controls the FrameStore’s current mode (Input or Output). It can be changed using this menu (if not in Auto mode and the device Task Mode is not Standard Tasks).
- Video Format — Indicates/controls the FrameStore’s current video format. It can be changed using this menu (if not in Auto mode and the device Task Mode is not Standard Tasks).
- VANC — Indicates/controls the FrameStore’s current VANC mode. It can be changed using this menu (if not in Auto mode and the device Task Mode is not Standard Tasks).
- FB Format — Indicates/controls the FrameStore’s current pixel format. It can be changed using this menu (if not in Auto mode and the device Task Mode is not Standard Tasks).
- VFlip — Indicates/controls the FrameStore’s vertical frame buffer orientation. Can be changed at any time.
- VancShift — Indicates/controls the FrameStore’s VANC Data Shift Mode. It can be changed when not in Auto mode and the device Task Mode is not Standard Tasks.
- Navigation and Data Selection
- Scrolling — The display can be scrolled horizontally and/or vertically.
- Use the vertical scroll bar to manually scroll the display up or down.
- Use the horizontal scroll bar to manually scroll the display left or right.
- If a scroll-wheel is available, move the cursor into the display, and roll the scroll wheel to scroll the display up or down.
- When there’s no current selection, use the up/down/left/right-arrow keys to scroll the display up/down/left/right, respectively.
- Use the Page-Up or Page-Down keys to scroll the display up or down by a larger amount.
- Press Home to scroll the upper-left corner of the current selection into view (or frame, if nothing selected).
- Press End to scroll the bottom-right corner of the current selection into view (or frame, if nothing selected).
- Vertical Ruler — This ruler labels lines (rows) in the display.
- Left-click (and optionally drag up or down) to select entire lines.
- Right-click to pop up a context menu:
- Units menu: Sets the vertical ruler's display units:
- Line Numbers — 1-based decimal line numbers relative to the start of the frame buffer.
- Lines With Fields — 1-based decimal line numbers relative to the start of the field … plus the field number (F1 or F2).
- SMPTE Lines — Decimal SMPTE line numbers (including field numbers, if interlaced).
- Bytes From Top — The hexadecimal offset, in bytes, from the start of the frame buffer.
- Bytes From Bottom — The negative hexadecimal offset, in bytes, from the bottom of the frame buffer.
- Device Memory Address — The hexadecimal byte offset into the device SDRAM.
- Note that the Image view always uses 1-based decimal line numbers relative to the start of the visible portion of the frame buffer (i.e., excludes any VANC lines).
- Fill menu: Sets all values in the line:
- Black — Fills the line with legal black.
- White — Fills the line with legal white.
- 0x000s — Clears (zeroes) the entire line.
- 0xFFFs — Fills the line with 0xFFs.
- Horizontal Ruler — This ruler labels columns in the display.
- Left-click (and optionally drag left or right) to select entire columns.
- Right-click to pop up a context menu:
- Units:
- Elements From Left Edge — 0-based decimal element numbers relative to the start of each line, where an element is the natural “chunk” of pixels for a given frame buffer format.
- Bytes From Left Edge — The decimal offset, in bytes, from the start of each line.
- Bytes From Left Edge (Hex) — The hexadecimal offset, in bytes, from the start of each line.
- Pixels From Left Edge — 0-based decimal pixel numbers, as measured from the start of each line.
- Note that the Image view always uses 0-based decimal pixel offsets relative to the left edge of the frame buffer.
- Fill Down menu: Sets all values in the column:
- Black — Fills the column with legal black.
- White — Fills the column with legal white.
- 0x000s — Clears (zeroes) the entire column.
- 0xFFFs — Fills the column with 0xFFs.
- Selecting — A rectangular region-of-interest of the raster (or raw memory) can be selected/highlighted, and is shown as a yellow box in the view.
- The current selection, if any, is described in the status bar, to the left of the refresh timing indicator.
- To cancel the current selection, press Escape.
- Switching views will attempt to retain the current selection. If this is not possible (e.g., switching from Raw to Image when a byte range outside the raster was selected), the selection will be reset/cancelled.
- Left-click in the display (and optionally drag up/down/left/right) to select a rectangular raster or memory portion.
- Vertically, Component, Image, and Line views will select line-by-line, whereas Raw views will select by a number of powers-of-two byte offsets.
- Horizontally, Image and Component views will select pixel-by-pixel, whereas Line and Raw views will select by 1/2/4/8-byte groups (depending on the current Grouping setting).
- Use the arrow keys to precisely and incrementally change the existing selection:
- By default, the selection will change to a single-element selection above/left of the top/left corner, or below/right of the bottom/right corner.
- Hold the Shift key down to expand the selection from the top/left or bottom/right corner.
- Hold the Ctrl (Command on MacOS) key down to shrink the selection from the top/left or bottom/right corner.
- Choose Select All from the Edit menu to select the entire raster (Image, Component or Line view) or frame buffer (Raw view).
- Moving the mouse cursor into the selection will cause a ToolTip to appear that describes the selection.
- Dragging the edge of the yellow selection box will resize the selection without moving it.
- Dragging from inside the selection box will change the selection’s position without changing its dimensions.
- Dragging from inside the selection box with both the Ctrl and Shift keys held down will copy the underlying raster data in the frame buffer to the position where the selection frame was moved (Line or Raw views only).
- Press Enter or Return to enter an interactive editing mode:
- Works in Lines or Raw view modes only.
- Starts in the selection’s top-left “cell”.
- Standard text editing behaviors apply.
- Press Escape to cancel and make no changes.
- Press Enter or Return to commit the change. This will replace every “cell” of the selection with the new value.
- Right-Click Operations
- View Mode — Changes the view to Lines, Raw, Components or Image.
- Grouping — (Lines and Raw views only) — Changes the data grouping to 8-bit (1-byte), 16-bit (2-byte), 32-bit (4-byte) or 64-bit (8-byte).
- Component Radix — (Components view only) — Changes the radix of the component data to Hexadecimal or Decimal.
- Show Components — (Components view only) — Enables/disables the display of the Luma/Cb/Cr/A or R/G/B/A components.
- Show Fields — (Lines and Components views only) — Enables/disables the display of lines F1, F2 or both.
- Bytes/Line — (Raw view only) — Changes the number of bytes to display in each line of the Raw data view. Choose from 64 bytes up to 32K bytes by powers of 2. Note that larger values make for fewer lines and many more columns. Smaller values show many more lines with fewer columns.
- Show/Hide Line Boundaries — (Raw view only) — Shows or hides the line boundary markers.
- Show Little/Big Endian — (Lines and Raw views only) — Toggles endianness of 16/32/64-bit word data display.
- Copy … (Image) — Copies the frame image (or the selected portion) to the host Clipboard.
- Copy … Data (Text) — Copies the frame data (or the currently-selected portion) to the host Clipboard. The data is encoded such that it’s readily usable in C/C++ code, as well as importing into spreadsheet and database programs (.csv).
- Copy … Description — Copies a description of the frame data (or the currently-selected portion) to the host Clipboard.
- Paste — (Auto mode OFF, and only if an entire frame was previously Copied) — Replaces the current 8/16/32MB frame with the 8/16/32MB frame that was Copied earlier.
- Clear — (Auto mode OFF only) — Zeroes the frame (or the currently-selected portion of it).
- Select All — Selects everything possible in the current view mode:
- Image view — Selects the visible lines of the frame.
- Lines and Components views — Selects the visible lines plus VANC lines (if VANC enabled).
- Waveform view — Selects the entire line that’s currently displayed.
- Raw view — Selects the entire 8/16/32MB buffer.
- Set Input/Output Frame Here — (Auto mode OFF, and current frame being viewed doesn’t match the FrameStore’s current Input or Output Frame) — Changes the FrameStore’s Input or Output Frame to the current frame being viewed.
- Fill Frames…:
- With no selection: opens the “Fill Buffer” Tool for filling device frame memory with specific values, colors, test patterns, etc.
- With a selection: pops up a submenu to fill the selection with:
- Legal Black — Fills the region with legal black.
- Legal White — Fills the region with legal white.
- All 0x00s — Zeroes (clears) the region.
- All 0xFFs — Fills the region with all 0xFFs.
- Edit Value… — (Auto mode OFF, Lines or Raw views, something selected) — Enters the interactive editing mode. See “Press Enter or Return” discussion above.
- Swap Byte Order — (Auto mode OFF, Lines or Raw views, 16/32/64-bit groups) — Swaps the byte order of the frame data (or the currently-selected portion).
- Compare to Frame… — (Auto mode OFF only) — Enables Frame Differencing mode, comparing the current frame with another, highlighting the differences. To cancel this mode, toggle the “Auto” setting, or change the current frame being viewed.
- Data Operations
- File menu
- Save As… — Saves the frame buffer contents to a file.
- The Auto checkbox must be un-checked.
- Choose the FrameStore and Frame of interest.
- Click in the File menu, then choose Save As….
- A standard file-save dialog box appears. Navigate to the folder on your local host where you want the file to be saved, and give it a name.
- IMPORTANT: The format of the data written to the file is View-dependent:
- Image — Writes a PNG image file of the raster selection, or, if there’s no selection, the full raster.
- Lines and Components — Writes a human-readable C-compilable dump of the raster selection, or, if there’s no selection, the full raster.
- Raw — Writes a raw, binary data file containing the contents of the entire frame buffer. This will be 8MB or 16MB for normal rasters. For “quad” 4K/UHD, it will be 8MB/16MB × 4. For “quad-quad” 8K, it will be 8MB/16MB × 16.
- Edit menu
- Copy — Copies the current selection to the “clipboard” that can be used in a subsequent “Paste” operation. The data written to the clipboard is View-dependent:
- Image — The selected raster image, or, if there’s no selection, the full raster.
- All Others — Text that’s a human-readable, C-compilable dump of the selected data, or if there’s no selection, the entire buffer.
- Select All — Selects everything possible in the current view mode:
- Image view — Selects the visible lines of the frame.
- Lines and Components views — Selects the visible lines plus VANC lines (if VANC enabled).
- Waveform view — Selects the entire line that’s currently displayed.
- Raw view — Selects the entire 8/16/32MB buffer.
- Buffer Editing — (Lines or Raw view only)
- This will fill a portion of the currently displayed frame buffer with a specific value that you enter from the keyboard.
- Highlight a selection area of any size.
- Press Enter (or Return).
- Type the new value in the edit box that appears.
- Press Enter (or Return) to fill the selection with the new value. Press Esc (or click outside the selection) to cancel.
- Drag and Drop
- The Auto checkbox must be un-checked.
- Choose the FrameStore and Frame of interest.
- Drag operations started from inside the Frame Buffer inspector view cannot end outside the view (not yet supported).
- Ctrl+Shift+Drag operations started from inside an existing selection in the Frame Buffer inspector (Line or Raw views only) will copy the underlying raster data to where it’s dropped in the frame buffer.
- Dropping files and/or folders from outside the NTV2Watcher window are supported. (Prior to SDK 15.3, only one file having a particular name extension could be dropped at one time.)
- The first frame buffer to be changed is determined by the frame number spinbox control. Subsequent files are loaded into successive frame buffers.
- The order of the files (and therefore which frame(s) get which file’s data) is host operating-system dependent.
- Dropped folders have their immediate contents enumerated.
- Symbolic links are skipped and not followed.
- Files are first attempted to be loaded as Image Files regardless of name extension.
- Most popular image formats are supported (e.g. PNG, JPG, BMP, etc.).
- If the image is decoded and loaded successfully, the frame’s visible raster content is replaced with the image.
- If the image dimensions differ from the frame geometry, the image is scaled to fit without altering its aspect ratio.
- Hold down the Shift key when dropping the file(s) to have the image’s aspect ratio changed to fill the raster. This will squish or stretch the image vertically or horizontally (or both).
- All other readable files are treated as Raw Binary Data Files:
- The frame’s buffer content is replaced byte-for-byte with the raw data from the file.
- If the raw file is smaller than the frame buffer, only the bytes from the file will overwrite the frame buffer. All subsequent content in the buffer will remain unchanged.
- If the raw file is larger than the frame buffer, subsequent frames will continue to be written until the remaining bytes from the file are read (or until the highest-numbered frame in device SDRAM has been DMA’d).
- Note
- Data coloring in the Frame Buffer Inspector can be configured in the Colors tab of the NTV2Watcher Preferences dialog.
Audio Inspector
The Audio inspector displays the input or output audio buffer memory of the AJA device in the context of an Audio System, including its read or write “head” position.
- Note
- Because this inspector reads (via DMA) the entire contents of an audio buffer at NTV2Watcher’s currently selected polling rate, it can interfere with any currently running application, particularly if the additional DMAs exceed the available device or host data transfer budget. Thus, this inspector is not immune from “Heisenbugs” in which the act of monitoring an AJA device affects it and the application(s) under test.
Audio buffer memory content can be displayed in any one of three ways:
- Raw — The entire buffer in per-channel “lines”, each sample value shown as a 4-byte (32-bit) longword.
- Waveform — A vertical stack of waveform plots for each audio channel that’s carrying PCM data.
- Phase — A phase plot of one audio channel against another. Both audio channels must be carrying PCM data.
When device polling is enabled (i.e. when the Poll checkbox is checked/ticked), this inspector monitors the audio system’s input or output buffer. At the given polling Interval rate, it reads the entire buffer into host memory, and compares it to its previous contents. The status bar shows the read or write head position, as well as what changed. The display highlights changed content in a brighter color.
- Audio System Controls and Indicators
- Audio System Selection and Configuration
- Audio System — Selects the audio system of interest.
- Rate — Indicates the audio system’s current sample rate. It can be changed using this menu (if the device Task Mode is not Standard Tasks).
- Size — Indicates the audio system’s current buffer size. It can be changed using this menu (if the device Task Mode is not Standard Tasks).
- Channels — Indicates the audio system’s current channel count. It can be changed using this menu (if the device Task Mode is not Standard Tasks).
- State Indicators
- A/C Indicator — Indicates if the audio system is being used by AutoCirculate, and if so, which AutoCirculate Channel.
- Active Pairs — Indicates which audio channel pairs are currently active.
- Non-PCM Pairs — Indicates which of the active audio channel pairs are carrying non-PCM data.
- Operation Controls
- Start — Click this button to start/run the audio system. If already running, the button is dimmed and indicates “Running”.
- Stop — Click this button to stop the audio system. If already stopped, the button is dimmed and indicates “Stopped”.
- Loopback — If checked, audio samples from the audio system’s source are routed directly into the output embedder(s) that are sourced from this audio system.
- Write-Enable — (Shown only in Input mode.) If checked, and if the capture audio system is running, captured audio will be written into the audio system’s capture buffer at the Write Head. Otherwise, the audio system will not be permitted to write into the capture buffer.
- Erase — (Shown only in Output mode.) If checked, the audio system will automatically write silence (i.e., zero values) into the output buffer immediately behind the Read Head.
- Embed — (Shown only in Output mode.) If checked, the audio system’s output audio embedder is enabled. If unchecked, the audio system’s output embedder is disabled, and will emit no audio packets.
- PCM Output — (Shown only in Output mode, and only for devices that lack per-audio-channel-pair PCM control.) If checked, the output embedder marks all outgoing audio packets as normal PCM. If unchecked, the output embedder marks all outgoing audio packets as non-PCM.
- Non-PCM Output — (Shown only in Output mode, and only for devices that have per-audio-channel-pair PCM control.) This popup menu lists all possible channel pairs. If a channel pair is checked, the output embedder marks outgoing audio packets for that channel pair as non-PCM. If a channel pair is unchecked, the output embedder marks outgoing audio packets for that channel pair as normal PCM.
- Mode and View Controls
- View — Controls which part of the audio system to inspect:
- Input — Inspects the input (capture) audio buffer. Look for changes up to the write head, where the de-embedder is writing new samples.
- Output — Inspects the output (playout) audio buffer. Look for changes ahead of the read head, where a playout application may be writing new samples.
- Auto — If checked, automatically and dynamically scrolls the display to reveal the audio data that immediately precedes the Read Head or follows the Write Head.
- Mon — If checked, sends new audio data to the host audio system. (Note: Because of the nature of digital audio, and the human ear’s sensitivity to interruptions or distortions in audio waveforms, monitoring audio should only be done with very short polling intervals.)
- AutoDetect — If checked, scans for muted channels or channels that contain Dolby-encoded audio data, and augments the Vertical Ruler scale accordingly.
- Source — (Shown only in Input mode.) This popup menu lists all possible audio sources for the audio system, and indicates the current source. The current source can be changed immediately using this menu.
- Other
- Status Bar — Indicates the audio system’s current Write Head (Input mode) or Read Head (Output mode) position, and which part of its sample buffer changed (if any).
- Navigation
- Scrolling — The display can be scrolled horizontally and/or vertically.
- Use the vertical scroll bar to manually scroll the display up or down.
- Use the horizontal scroll bar to manually scroll the display left or right.
- If a scroll-wheel is available, move the cursor into the display, and roll the scroll wheel to scroll the display up or down.
- Use the up-arrow or down-arrow keys to scroll the display up or down.
- Use the left-arrow or right-arrow keys to scroll the display left or right.
- Use the page-up or page-down keys to scroll the display up or down by a larger amount.
- Vertical Ruler — This ruler identifies each audio channel in the display. Each channel can be augmented with “Absent”, “PCM” or “Non-PCM” (or “Mute” or “Non-PCM Dolby” with AutoDetect enabled).
- Right-click to change the Vertical Scale. Choose from “Shortest” to “Tallest”.
- Horizontal Ruler — This ruler identifies the offset into the audio buffer of each column (or pixel, horizontally) in the audio buffer.
- Right-click in the horizontal ruler to pop up the Units menu:
- Byte Offset — Shows the buffer offset as a byte count, in hexadecimal.
- Samples — Shows the buffer offset as a zero-based decimal sample index number.
- Seconds — Shows the buffer offset as a fixed-point decimal time value (in microseconds, milliseconds, or seconds, as appropriate).
- Abs Address — Shows the buffer offset as an absolute physical device SDRAM address (in hex).
- This setting affects the units used in the Change Indicator in the status bar.
- Right-click in the display to pop up a context-sensitive menu:
- View menu:
- Raw — Switch to the Raw view.
- Waveform — Switch to the Waveform view.
- Phase — Switch to the Phase view.
- Units menu (Raw View only):
- Hex — Shows raw sample data as 4-byte hexadecimal values.
- Decimal — Shows raw sample data as decimal values.
- Percent — Shows raw sample data as a decimal percentage of maximum.
- Float — Shows samples as floating point values.
- dB — Shows samples in decibels.
- Scale menu (Waveform View only):
- Fit in Window — Shows all samples in audio buffer in the window.
- 1:1 — Shows 1 sample per pixel.
- 1:2 — Shows 2 samples per pixel.
- 1:4 — Shows 4 samples per pixel.
- 1:8 — Shows 8 samples per pixel.
- 1:16 — Shows 16 samples per pixel.
- Copy Waveform — (Waveform View only) — Copies the selected waveform to the host’s clipboard.
- Copy Text — (Raw View only) — Copies the selected samples to the host’s clipboard.
- Copy All Raw Data — Copies the entire buffer to the host’s clipboard.
- Paste Raw Data — Pastes the entire buffer into the audio buffer. Available only if previously copied from an Audio inspector view.
- Clear — Sets the selected samples in the audio buffer to zero (silence).
- Import Audio… — Opens a file-picker dialog to choose an audio file to import and fill the audio buffer.
- Export WAV… — Opens a file-save dialog, and if confirmed, exports the selected audio samples to a WAV audio file.
- Export RAW… — Opens a file-save dialog, and if confirmed, copies the selected audio samples from the audio buffer into a RAW audio file.
- View in Frame Buffer — Shows the selected audio samples in the Raw View of the Frame Buffer Inspector .
- Selecting — A rectangular region-of-interest of the audio buffer can be selected/highlighted, and shown as a yellow box in the view.
- The current selection, if any, is described in the status bar, to the left of the refresh timing indicator.
- To cancel the current selection, press Escape.
- Switching views will attempt to retain the current selection. If this is not possible, then the selection will be reset/cancelled.
- Left-click in the display (and optionally drag up/down/left/right) to select a portion of the audio buffer.
- Vertically, one or more Channels will be selected.
- Horizontally, one or more Samples (sometimes called “frames”) will be selected.
- Use the arrow keys to precisely and incrementally change the existing selection:
- By default, the selection will change to a single-sample selection above/left of the top/left corner, or below/right of the bottom/right corner.
- Hold the Shift key down to expand the selection from the top/left or bottom/right corner.
- Hold the Ctrl (Command on MacOS) key down to shrink the selection from the top/left or bottom/right corner.
- Choose Select All from the Edit menu to select all samples in the buffer.
- Moving the mouse cursor into the selection will cause a ToolTip to appear that describes the selection.
- Dragging from inside the selection box will start making a new selection.
Use the “Tone Generator” Tool to fill the audio output buffer, either statically (one-time data fill) or dynamically (continuously).
Ancillary Data Inspector
The Anc inspector monitors the ancillary data regions inside device memory, including the state registers of the device’s SDI Anc inserter/extractor widgets (if any).
- Note
- Because this inspector frequently reads (via DMA) all or part of a frame buffer, it can interfere with any currently running application, particularly if the additional DMAs exceed the available device or host data transfer budget. Thus, this inspector is not immune from “Heisenbugs” (the Heisenburg Uncertainty Principle) in which the act of monitoring an AJA device affects it and the application(s) under test.
The Anc inspector has two main sections:
- Controls that are common to all tabs are located at the top:
- Anc Buffer Capacity — Indicates the current maximum ancillary data buffer capacity.
- The popup menu allows the capacity to be changed.
- 8KB is the default.
- Choose from 4K up to 256KB.
- This section is absent on devices that don’t have Anc inserter/extractor firmware.
- Show Absent Packets — If checked/ticked (the default), every Packet Display will show missing packets (those that appeared at least once and then not seen again).
- Snapshot — This pushbutton is enabled whenever the “Scrap Buffer” Tool tool window is open.
- Push the button to transmit a frame-accurate snapshot of the Anc buffer(s) into a new tab in the “Scrap Buffer” Tool window.
The rest of the panel space has one or more tabs that display ancillary data from different buffer locations in the device.
There are two classes of tabs:
- Channel/FrameStore Tab — Inspects ancillary data in a frame that’s associated with a FrameStore/Channel.
- There are three sections stacked vertically:
- Frame Indicator/Selector & Status Indicator
- On/Off Indicator: Indicates if the FrameStore is enabled (“On”) or disabled (“Off”).
- Frame: When available, controls which frame buffer to view. When unavailable, indicates the frame buffer being viewed.
- Auto — If checked/ticked, the frame buffer being monitored will automatically follow the FrameStore’s input or output frame register, and the frame buffer number spin control will be disabled. If unchecked, the frame buffer number is manually controlled.
- Video Format Indicator — Indicates the FrameStore’s current video standard, frame rate, geometry, pixel format, and intrinsic frame size.
- Frame Buffer Line 21 Region
- This section is kept hidden unless the FrameStore is configured for 525i SD.
- Line 21 (F1): Displays the byte pairs decoded from line 21 (if any).
- Line 284 (F2): Displays the byte pairs decoded from line 284 (if any).
- Frame Buffer VANC Region
- This section displays the VANC region of the frame buffer (if any). It is hidden if the FrameStore is disabled.
- VANC: — This menu controls the ancillary data display:
- Hide — Hides the buffer data display.
- Raw — Displays the VANC region (if any) data as raw data. (See Raw Data Display.)
- Packets — Decodes the VANC region (if any) data, and lists the decoded ancillary data packets. (See Packet Display.)
- Mode — Indicates and/or controls the current VANC Mode of the FrameStore:
- Vanc Shift — Indicates/controls the FrameStore’s VANC Data Shift Mode.
- Anc Extractor/Inserter Tab
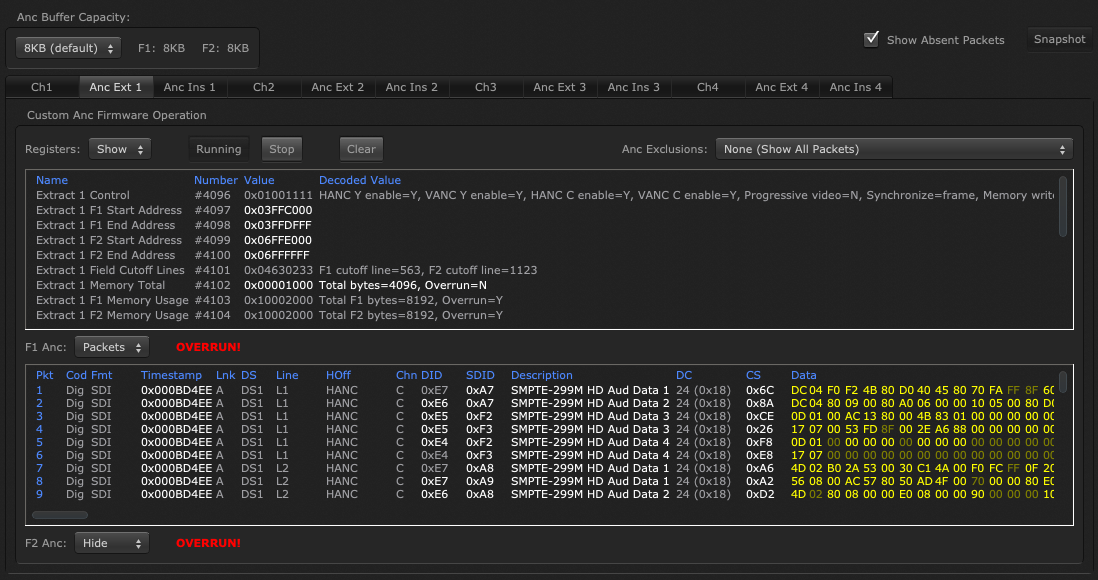
- This type of tab is present only for devices that have Anc inserter/extractor firmware.
- It has three major sections stacked vertically:
- Control & Registers Area
- Registers: — This menu controls the inserter/extractor register display:
- Hide — Hides the register display.
- Show — Displays the registers.
- Run button — Click to start the inserter/extractor. Displays “Running” when running.
- Stop button — Click to stop the inserter/extractor. Displays “Stopped” when stopped.
- Clear button — Click to clear/zero the Anc region of device frame buffer memory.
- Anc Exclusions: menu (for Anc Extractor tabs only) — Indicates which Anc packet types (Data IDs) are currently being excluded by the Anc Extractor. It can be used to add or remove Anc packet types from the exclusion set.
- None (Show All Packets) — Checked if the Anc Extractor is not filtering any packets. Choose this item to stop all packet filtering (i.e. to extract all packet types).
- SD Defaults — Checked if the Anc Extractor is not filtering SD audio packets. Choose this item to filter all SD audio packets.
- HD Defaults — Checked if the Anc Extractor is not filtering HD audio packets. Choose this item to filter all HD audio packets.
- all other items — The menu has dozens of pre-defined Anc packet types available for filtering. For each Anc packet type (i.e. Data ID, or DID)…
- If checked, the Anc Extractor is currently filtering that packet type (Data ID). Selecting the item will toggle its state and remove the DID from the Extractor’s filter set.
- If unchecked, the Anc Extractor is not currently filtering that packet type (Data ID). Selecting the item will toggle its state and add the DID to the Extractor’s filter set.
- Anc Register Display
- Visible only when the Registers menu is set to Show.
- It shows each of the inserter/extractor configuration registers.
- The register values are editable.
- Field 1 Area
- F1 Anc: — This menu controls the F1 Anc data display:
- Hide — Hides the F1 buffer data display.
- Raw — Displays the F1 Anc region data as raw data. (See Raw Data Display.)
- Packets — Decodes the F1 Anc region data, and lists the decoded ancillary data packets. (See Packet Display.)
- Max Capacity: — This indicates the current maximum capacity of the F1 Anc region, in bytes.
- Overrun Indicator (capture mode only) — This indicator will be visible and bright red if the F1 extractor is attempting to write past the end of its allotted buffer space.
- Data Display Area
- When shown, displays the “raw” F1 data buffer or the list of packets that were decoded from the buffer area.
- Field 2 Area
- F1 Anc: — This menu controls the F2 Anc data display:
- Hide — Hides the F2 buffer data display.
- Raw — Displays the F2 Anc region data as raw data. (See Raw Data Display.)
- Packets — Decodes the F2 Anc region data, and lists the decoded ancillary data packets. (See Packet Display.)
- Max Capacity: — This indicates the current maximum capacity of the F2 Anc region, in bytes.
- Overrun Indicator (capture mode only) — This indicator will be visible and bright red if the F2 extractor is attempting to write past the end of its allotted buffer space.
- Data Display Area
- When shown, displays the “raw” F1 data buffer or the list of packets that were decoded from the buffer area.
Raw Data Display
- Displays the contents of the buffer as raw numeric data.
- Available in the VANC, F1 Anc and F2 Anc sections by choosing Raw in the menu.
- Data that changed from the previous buffer sample is highlighted with a brighter color.
- Right-click in the data content area to change how the data is formatted:
- Grouping — Choose byte grouping from 1, 2, 4 or 8 bytes.
- Radix — Choose from binary, octal, decimal or hexadecimal.
- Bytes/Line — Choose from 8, 16, 32, … up to 4096 bytes per line.
- Note
- The bytes-per-row count of the VANC display is fixed by the channel’s frame geometry, and is not adjustable.
- Right-click in the column heading area to change the horizontal scale:
- Reference — Choose Byte Offset From Start or Byte Offset From End.
- Radix — Choose Dec (Base 10) or Hex (Base 16).
- Right-click in the row heading area to change the vertical scale:
- Reference — Choose Byte Offset From Start or Byte Offset From End.
- Radix — Choose Dec (Base 10) or Hex (Base 16).
Packet Display
- Displays a list of ancillary data packets parsed from the buffer.
- Note
- For buffers written by the Anc Extractor firmware, the parser simply attempts to decode whatever packets it finds in the buffer. It’s generally not possible for NTV2Watcher to frame-accurately obtain the Inserter’s bytes-written counter. Thus it’s possible for invalid or stale packets to appear in the packet list. It can help to clear the Anc buffer (use the Clear button) and see if the suspected bad packets disappear.
- Available for the VANC, F1 Anc and F2 Anc buffers by choosing Packets from the display control menu.
- For each packet, it shows, in columns:
- Pkt — The index number in the list.
- Cod — Coding – Analog or Digital.
- Fmt — Originating Buffer Format: SDI, RTP or VANC.
- Timestamp — For RTP, the timestamp from the RTP header; otherwise, a frame sequence number.
- Lnk — The data link (A or B).
- DS — The data stream (DS1 … DS4).
- Line — On capture, the SMPTE line number where the data was found; on playout, the SMPTE line number where the data is to be inserted.
- HOff — Horizontal Offset: or HANC or VANC.
- Chn — Channel: Luma (Y) or chroma (C).
- DID — The DID of the packet.
- SDID — The SDID of the packet.
- Description — Packet description.
- DC — Data Count of the payload data, in bytes (decimal and hex).
- CS — The checksum of the payload data, in hexadecimal. On playout, this value is irrelevant, since the inserter/embedder performs the checksum computation.
- Data — A dump of the first several bytes of payload data.
- Data values that changed from the previous buffer sample are highlighted with a brighter color.
- Packets missing from the prior buffer sample are shown in red (as “missing”).
- This behavior can be disabled by unchecking Show Absent Packets (near the top of the inspector).
Choose Copy from the Edit menu to copy a human-readable snapshot of the displayed information to the Clipboard.
Closed-Caption Display
- This inspector can be used to drive the “EIA/CEA-608 Caption” Tool for monitoring closed-captions.
- To prevent duplicate or multiple caption byte streams from being sent to the “EIA/CEA-608 Caption” Tool …
- Only one of the Anc buffer regions should be visible, and it must be set to display “Packets”.
- Only one caption packet should be listed in the packet list.
- Note
- Hiding unneeded buffer displays uses fewer CPU resources, helping the inspector update at frame rate (which increases the fidelity of the “EIA/CEA-608 Caption” Tool, if needed).
Drag and Drop Support
- Auto mode must be disabled (un-checked).
- Dropping a single file from outside the inspector window is supported.
- Dropping the file into the F1 Anc or F2 Anc data areas (if visible, in either Raw or Packets view) will write the binary contents of the file into the Anc region of the frame buffer.
- Dropping the file into the VANC Anc data area (if visible, in either Raw or Packets view) will write the binary contents of the file into the VANC lines (if VANC mode enabled) of the frame buffer.
- Note
- Data coloring in the Ancillary Data Inspector can be configured in the Colors tab of the NTV2Watcher Preferences dialog.
This inspector monitors the buffer region(s) for the currently-selected tab.
- It reads (via DMA) the anc buffer portion into host memory.
- For Channel (FrameStore) tabs:
- It reads all VANC lines that precede the first visible line in the raster.
- For SD video, it reads all visible raster lines (to ensure it gets line 21 for “analog” captions).
- For Anc inserter/extractor tabs, if the inserter/extractor is actively writing/reading device memory:
- …it will read the Anc region pointed to by its Start Address registers (whichever is lower).
- When the Poll checkbox is checked/ticked, this inspector attempts to refresh at the FrameStore’s current frame rate (as soon after the VBI as possible).
- An indicator in the bottom-right corner of the main window’s status bar shows the actual, measured refresh rate.
- When the indicator’s color is not Green, then the inspector is not frame-accurate, and the data being presented is late (stale).
- When polling is disabled, it will only update when the Refresh button is manually pressed.
- After each refresh, it compares the frame buffer contents to what was read the last time:
- The data display highlights changed content with a brighter color.
AutoCirculate Inspector
The AutoCirculate inspector monitors the AutoCirculate state for every available channel on the device. When the Poll checkbox is checked/ticked, this inspector updates at the given polling Interval rate. Information that changed from the last update is shown in a brighter color.
The inspector shows the following:
- Streaming Application — Shows the process ID and four-CC “signature” of the application that called CNTV2Card::SetStreamingApplication. See Sharing AJA Devices With Other Applications for more information.
- AutoCirculate Status — Formats and displays AUTOCIRCULATE_STATUS information pulled from the CNTV2Card::AutoCirculateGetStatus function call for each NTV2Channel.
- Timecodes — This area shows the contents of the NTV2TimeCodeList returned from CNTV2Card::AutoCirculateGetFrameStamp for each AutoCirculate frame buffer. Use the Timecodes popup menu to control which channel to display (or “Hide” to not display timecodes).
- Note
- This area doesn’t appear on S2110 devices (i.e. KONA IP Io IP running S2110 firmware). This is because the driver’s internal AutoCirculate structures are tied to the hardware timecode registers, which are uninvolved in S2110. In S2110, timecodes are obtained (capture) or produced (playout) in ATC-LTC or ATC-VITC packets embedded in RTP packet(s).
The inspector also provides the ability to control AutoCirculate.
- Force Release — Click to force the release of a streaming application that had previously reserved the device for exclusive use. See Sharing AJA Devices With Other Applications for more information.
- Right-clicking anywhere in a channel column will pop up a menu with these commands:
AutoCirculate Configuration Dialog
The AutoCirculate configuration dialog is used to configure a stopped AutoCirculate channel that is to be started, or to reconfigure a running AutoCirculate channel (by restarting it with new operating parameters).
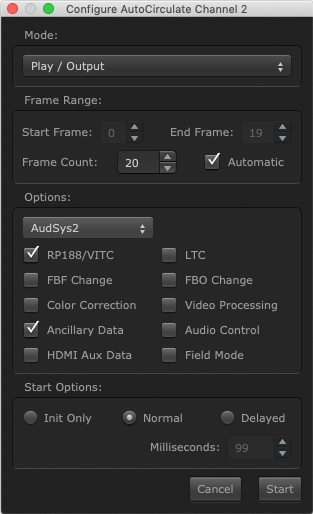
- For a Running channel, clicking the Restart button will restart the AutoCirculate channel with the new settings specified in the dialog.
- For a Stopped channel, clicking the Start button will start the AutoCirculate channel with the settings specified in the dialog.
- Mode: Selects AutoCirculate Capture or AutoCirculate Playout. (This menu will be disabled if the channel is Running.)
- Frame Range: This group controls which frame buffers on the device will be used for buffering frames.
- Start Frame: Chooses the starting frame number. (This will be disabled if Automatic is checked.)
- End Frame: Chooses the ending frame number. (This will be disabled if Automatic is checked.)
- Frame Count: Chooses the number of frames to be used.
- Automatic: Given the desired Frame Count, lets AutoCirculate automatically choose which frames are to be used.
- Options: This group controls the AutoCirculate options.
- Audio: Controls if audio will also be streamed, and if so, which NTV2AudioSystem to use.
- RP188/VITC: If checked, capture/play RP188/VITC timecode.
- FBF Change: If checked, tells AutoCirculate to anticipate changes to NTV2FrameBufferFormat while streaming.
- Color Correction: If checked, tells AutoCirculate to anticipate LUT changes while streaming.
- Ancillary Data: If checked, tells AutoCirculate to also capture/play custom ancillary data while streaming.
- HDMI Aux Data: If checked, tells AutoCirculate to also capture/play custom HDMI auxiliary data while streaming.
- LTC: If checked, tells AutoCirculate to also capture/play LTC while streaming.
- FBO Change: If checked, tells AutoCirculate to anticipate NTV2FBOrientation changes while streaming.
- Video Processing: If checked, tells AutoCirculate to anticipate Mixer/Keyer configuration changes while streaming.
- Audio Control: If checked, tells AutoCirculate to anticipate Audio Control changes while streaming.
- Field Mode: If checked, tells AutoCirculate to stream in Field Mode rather than the default Frame Mode.
- Start Options: This group controls how AutoCirculate will be initialized/started:
- Init Only: If chosen, only CNTV2Card::AutoCirculateInit will be called. (CNTV2Card::AutoCirculateStart will not be called.)
- Normal: If chosen, AutoCirculate will be initialized and started normally (CNTV2Card::AutoCirculateStart is called with default parameters).
- Delayed: If chosen, AutoCirculate will be initialized (see CNTV2Card::AutoCirculateInit) and started (via CNTV2Card::AutoCirculateStart) with a non-zero start time value:
- Milliseconds: Specifies the number of milliseconds to delay the start.
Choose Copy from the Edit menu to copy a human-readable frame-accurate snapshot of the AutoCirculate state of the device to the Clipboard.
Mixer/Keyer Inspector
The Mixer/Keyer inspector monitors and controls the device’s Mixer/Keyer Operation .
There is a group of controls for each Mixer/Keyer widget on the device:
- Mixer Sync — Indicates if the Mixer’s inputs are in-sync or not.
- Foreground Input — Shows what’s connected to the Mixer’s Foreground Video and Key inputs.
- Background Input — Shows what’s connected to the Mixer’s Background Video and Key inputs.
- Mode — Indicates and controls the Mixer’s mode. Choose from:
- Foreground ON — Foreground video and key is exclusively passed to the Mixer output.
- Mix — A mix of the foreground video over the background video is passed to the Mixer output. If either foreground or background Flat Matte is enabled, the Matte will be mixed instead of its respective video input.
- Foreground OFF — Background video and key is exclusively passed to the Mixer output.
- Mix Coefficient — Indicates and controls the mix. Disabled when not in Mix Mode.
- Foreground Input Control — Indicates and controls what gets selected from the foreground input raster.
- Full Raster — Uses the full raster, disregarding any Foreground Key input.
- Shaped — Uses the Foreground Key input as a mask.
- Background Input Control — Indicates and controls what gets selected from the background input raster.
- Full Raster — Uses the full raster, disregarding any Background Key input.
- Shaped — Uses the Background Key input as a mask.
- Matte Control — Indicates and controls the Flat Matte feature, which overrides an input raster with a flat field of constant luminance and color:
- Off — Disables the feature.
- Foreground — Use the current Flat Matte color for the foreground.
- Background — Use the current Flat Matte color for the background.
- Matte Color — Indicates and controls the Flat Matte color. Disabled if the Matte Control is “Off”. To change the color, click the color swatch pushbutton, which brings up a color picker dialog box. Choose OK to set the selected color.
- Output VANC Source — Indicates and controls the Mixer‘s VANC pass-through.
- Background Video — Passes the background video’s VANC lines to the Mixer output.
- Foreground Video — Passes the foreground video’s VANC lines to the Mixer output.
Choose Copy from the Edit menu to copy a human-readable snapshot of the state of all Mixers to the Clipboard.
LUT Inspector
The LUT inspector monitors and controls any one of the device’s LUT banks (see LUT Operation ). Because of access contention issues, it does not continually poll and update its LUT display. Instead, the displayed table data must be manually loaded from the device on demand.
- The data display is a 1,024-row table with three columns, one column per color component. It represents the contents of an in-host data buffer.
- To load the in-host data buffer from the device, set the LUT of interest using the menu control, then right-click inside the table, and choose one of the Load from Bank commands. The contents of the in-host buffer are replaced.
- To write/save the in-host data buffer to the device, set the LUT using the menu control, then right-click inside the table, and choose one of the Write to Bank commands.
- To write/save the in-host data buffer to a host file, right-click inside the table, and choose an Export command.
- The table can be edited any time:
- Make selections with the mouse and/or keyboard.
- Right-click in the table to pop up a context menu of several commands:
- Copy — Copies the highlighted cell data into the host scrap buffer for pasting elsewhere later.
- Paste — Pastes the host clipboard contents into the table starting at the top-left highlighted cell.
- Select All — Highlights all cells in the table.
- Set From Predefined… — Pops up a submenu of predefined LUTs, that if chosen, will replace the table contents:
- Linear — With this LUT, output component values will exactly match input component values.
- Gamma 18 Rec601 (Full)
- Gamma 18 Rec709 (Full)
- Gamma 18 Rec601 (SMPTE)
- Gamma 18 Rec709 (SMPTE)
- RGB Full-Range SMPTE
- Import… — Presents a standard file-picker dialog for choosing a CSV or tab-delimited data file to import. If confirmed, replaces the in-host buffer with the contents of the chosen data file.
- Export Text… — Presents a standard file-save dialog for exporting the table into a tab-delimited text file.
- Export CSV… — Presents a standard file-save dialog for exporting the table into a CSV file.
- Load from Bank N — Discards the in-host buffer, and replaces its contents with the requested LUT bank from the device.
- Write to Bank N — Writes the in-host buffer to the requested LUT bank on the device.
- Fill Selection — Fills the highlighted cells with the value of the right-clicked cell.
- Fill Down — Fills all highlighted cells with the values of the top-most cells.
- Fill Right — Fills all highlighted cells with the values of the left-most cells.
- Clear — Fills all highlighted cells with zero.
- Invert — Inverts the values in all highlighted cells (i.e. subtracts its current value from 1023).
- Double-click in a table cell to change its value.
- There is some Drag & Drop support:
- Dropping a CSV or tab-delimited data file into the table will replace some/all the in-host data buffer cell values with the contents of the file.
- Excess columns and/or rows are ignored in files containing more than 3 columns or more than 1024 rows.
- If the drop location is inside the table, the in-host buffer will be overwritten starting at the highlighted cell; otherwise, it will be overwritten starting at the top/left data cell.
- Changes made to the table are not saved unless explicitly exported (or copy/pasted) into a file, or written to the device. No warnings are given before replacing/overwriting the in-host table buffer being edited. There is no Undo facility.
Registers Inspector
The Regs inspector monitors any number of real and/or virtual 32-bit registers at the current Polling Interval. Its Filter feature permits immediate customization to focus on specific registers of interest.
When the Poll checkbox is checked/ticked, this inspector updates at the given polling Interval rate. Register contents that changed from the last update are shown in a brighter color.
The inspector has the following:
- A scrollable table of registers, one register per row, in ascending register number (i.e. bar address) order.
- Virtuals — A checkbox that controls if virtual registers are included in the list or not.
- Bulk Reg Read — A checkbox that controls if registers are read in a single driver call or not.
- Filter — An editable text box whose content determines which registers are seen in the list. It’s accompanied by a pop-up menu containing several named register groups, and any saved filters. The text in the box acts as a filter:
- empty — No filtering takes place. All registers are shown.
- non-empty — Filtering takes place. Any of the following specifications that are separated by whitespace (any number of spaces or tabs) and/or commas:
- Class Name — e.g.
kRegClass_Audio — shows registers that belong to that class.
- The accompanying popup menu contains these predefined register groups (e.g. inputs, outputs, HDMI, etc.).
- Name Fragment — shows registers whose name contains the given text fragment (without regard to case).
- Register Range — shows only those registers in the given range:
{regSpec} [{'-'} {regSpec}] …or…[{decNum} '@'] {regSpec}
- Register Specification —
regSpec — specifies a single register (or a byte offset to one):
['+'] {decNum} …or…['#'] ['0'] {'x'|'X'} {hexNum}
- Decimal Number —
{decNum} — a sequence of decimal digits that yields an unsigned integer value
- Specifies a register number by default
- Specifies a byte offset when preceded by
'+' sign
- Hexadecimal Number —
{hexNum} — a sequence of hex digits (0-9 | A-F | a-f)
- Specifies a byte offset by default
- Specifies a register number when preceded by
'#' sign
- Examples:
25 — Only show register 2525-29 — Shows registers 25, 26, 27, 28 and 29.5@25 — Shows 5 registers starting at register 25: 25, 26, 27, 28 and 29.3 5, 7,,,9 — Shows registers 3, 5, 7 and 9.dma3 — Shows all registers that have “dma3” in their name.+4-+12 — Shows registers 1, 2 and 3 (i.e. the registers from byte offset 4 through byte offset 12).#0x8A-#X8f — Shows registers 138, 139, 140, 141, 142 and 143 (i.e. the registers from byte offset 0x8A through byte offset 0x8F).
- Save — Available if the filter text isn’t currently a preset in the popup menu. Click to save the filter as a new preset.
- Remove — Available if the filter text matches a previously-saved preset in the popup menu. Click to remove it from the popup menu.
The register list is a table of register values that is always sorted in ascending register number order. Right-clicking in any of the column headings pops up a menu:
- Column Display — Controls which columns are shown, and their order:
- Number — The register number
- Offset — The register offset into its base address range (BAR).
- Name — The register name.
- Class — The class(es) the register belongs to.
- Value — The register value.
- Desc — The register description.
- Decoded Value — Text that shows the register value in a human-readable format.
- Radix — Controls the radix of the numbers displayed in the column:
- Bin (Base 2) — Display register values in base 2 (binary).
- Oct (Base 8) — Display register values in base 8 (octal).
- Dec (Base 10) — Display register values in base 10 (unsigned decimal).
- Hex (Base 16) — Display register values in base 16 (hexadecimal).
- Hide This Column — Hides the column that was right-clicked.
There are two ways to change a register’s value:
- Click inside the register value. This will cause an edit box to appear. Then…
- Change the value in the edit box as desired (keeping to the existing display radix).
- Press Enter or Return to confirm your changes, and write the new register value to the device. The edit box will disappear.
- Press Escape or click elsewhere to abandon your changes. The edit box will disappear.
- Right-click in any column other than the Value column to pop-up a context menu:
- Clear All Bits — Sets the register value to zero.
- Clear Bit — Pops up a sub-menu to clear/zero a specific bit.
- Set All Bits — Sets all register bits (i.e. sets the register value to
0xFFFFFFFF).
- Set Bit — Pops up a sub-menu to set a specific bit to
1.
- Increment — Adds 1 to the register value.
- Decrement — Subtracts 1 from the register value.
- Shift Left — Left-shifts all bits by one (i.e. multiplying by 2).
- Shift Right — Right-shifts all bits by one (i.e. dividing by 2).
Choose Copy from the Edit menu to copy to the host’s Clipboard a set of CNTV2Card::WriteRegister function calls that will produce the register values seen in the display.
TIP: The “Register Cycler” Tool can be used to periodically cycle a register between a minimum and maximum value.
Routing Inspector
The Routing inspector monitors and controls widget signal crosspoint routing as well as widget state (to some degree).
- Note
- This inspector replaces the original usingcables utility with this significant difference:
- RGB and YCbCr output crosspoints are shown in separate sockets. In the old usingcables they were shown as one socket, which caused some confusion.
The inspector has the following individual panels:
- Routing Diagram — Shows the device widgets and signal connections between them.
- Code — A text-only representation of the device’s current routing connections. It can display the routing in three different ways:
- C++ Code — C++ code that will produce the current routing configuration using CNTV2Card::Connect calls. This is the default.
- Shorthand — Widget connections are shown mnemonically.
- Routing Registers — A panel containing a list of the device’s routing registers. The register values are editable, and can be changed.
Choose Print… from the File menu to print a two-page report of the current routing configuration.
Choose Copy from the Edit menu to copy a human-readable snapshot of the displayed routing information to the Clipboard.
This inspector will accept plain text either pasted in (using the Paste command from the Edit menu), or by dropping it in (using drag-and-drop) from another application. To be interpreted correctly as a set of routing connections, the text must syntactically conform to:
- C++ Statements — One or more lines, each containing a call to CNTV2Card::Connect :
- Shorthand Notation — One or more lines having the “shorthand” notation:
FB1 <== SDIIn1
CSC1 <== SDIIn1
CSC2 <== SDIIn1DS2
LUT1 <== CSC1RGB
LUT2 <== CSC2RGB
SDIOut3 <== SDIIn1
SDIOut4 <== SDIIn1DS2
HDMIOutQ1 <== SDIIn1
AnalogOut <== SDIIn1
Routing Diagram
The Routing Diagram is where routing changes are performed interactively. This is the panel in which most tasks are performed.
There are these principal types of objects in the diagram:
- Widgets — These represent the functional widgets implemented in the device firmware, such as FrameStores, SDI Inputs, etc.
- Widgets contain one or more Sockets that represent each of the Widget’s crosspoint connections.
- Sockets are little square boxes inside a Widget. They cannot move independently — they always move with their owning Widget. There are two kinds of Sockets:
- Input — This is a signal “sink” or “destination” crosspoint.
- Inputs are always on the widget’s left side.
- Inputs can only be connected to one Output crosspoint.
- Depending on the parent Widget, Input Sockets sometimes can accept both RGB or YCbCr signals, or only RGB or YCbCr.
- Output — This is a signal “source” crosspoint.
- Outputs are always on the widget’s right side.
- Outputs can be connected to any number of Input crosspoints.
- Outputs have a fixed signal type that they emit (if enabled): YCbCr or RGB.
- Sockets can be logically enabled or disabled, usually determined by the parent Widget’s configuration.
- Cables/Wires — These represent the currently existing widget crosspoint connections, as read from the device’s “crosspoint select” registers.
Standard behaviors:
- Hovering
- Hovering the mouse pointer over any object will display a “Tool Tip” that gives detailed information about the object and its current state.
- Right-Clicking
- On widgets — Displays a context menu with commands that are relevant for the widget in its current state.
- Disconnect — Disconnects whatever is connected to the widget.
- Show Legal Routes — On devices that support this feature, displays all implemented crosspoint routes from every input socket and output socket.
- Hide Legal Routes — Hides any/all displayed implemented crosspoint routes.
- On enabled output sockets — Displays a context menu with these commands:
- Disconnect — Disconnects whatever is connected to the output socket, breaking the connection. (This command will be dimmed if the output socket has nothing connected to it.)
- Connect To… — Pops up a submenu listing the available widget input socket connections.
- Show Legal Routes — On devices that support this feature, displays all implemented crosspoint routes from the socket.
- Hide Legal Routes — Hides any/all displayed implemented crosspoint routes that originate with the socket.
- On enabled input sockets — Displays a context menu with these commands:
- Disconnect — Disconnects whatever is connected to the input socket, breaking the connection. (This menu command will be dimmed if the input socket has nothing connected to it.)
- Connect To… — Pops up a submenu listing the available widget output socket connections. This command will be labeled “Reconnect To…” if the input socket already has a cable connected to it.
- Show Legal Routes — On devices that support this feature, displays all implemented crosspoint routes that can terminate in the input socket.
- Hide Legal Routes — Hides any displayed implemented crosspoint routes that terminate at the input socket.
- On cables — Displays a context menu with these two commands:
- Copy (Source Code) — Copies the source code containing the CNTV2Card::Connect function call that’s relevant to the cable — i.e. the connection — to the clipboard.
- Disconnect — Disconnects the cable, breaking the connection.
- On Framestores:
- Disable or Enable
- Set to Playout or Set to Capture
- Video Format — Changes the Framestore’s video format. If the device is Multi-Format capable, it will globally change the device to multi-format mode.
- Pixel Format — Changes the Framestore’s frame buffer format.
- 4K Mode — Changes the Framestore’s “quad” mode to “squares” or “TSI” (if device is 4K-capable).
- Inspect — Opens the Framestore’s Frame Buffer Inspector.
- Fill… — Opens the “Fill Buffer” Tool .
- Write Test Pattern — Writes the chosen test pattern into the Framestore’s current Output Frame (playback mode only).
- On CSCs:
- Colorspace Matrix — Choose “Rec601” or “Rec709”.
- RGB Range — Choose “Full” or “SMPTE”.
- Alpha Output — Choose “Opaque” or “From Key”.
- On LUTs:
- LUT Type — Immediately rewrites the chosen LUT type to both banks of the LUT.
- Bank — Immediately changes the active LUT output bank.
- Inspect — Opens its LUT Inspector.
- On Mixer/Keyers:
- On SDI Inputs:
- Disable Input or Enable Input — For bidirectional SDI connectors, immediately changes its direction.
- 3Gb->3Ga Conversion — (3G/6G/12G only) Enables or disables the input’s 3Gb-to-3Ga converter.
- CRC Checking — (3G/6G/12G only) Enables or disables the input’s CRC error checking.
- On SDI Outputs:
- Disable Output or Enable Output — For bidirectional SDI connectors, immediately changes its direction.
- SDI Output Standard — Sets the output’s video standard.
- Video Limiting — Sets SDI output video limiting for all device SDI outputs.
- Off — Disables output limiting.
- Legal SDI — SDI video output is limited to legal SDI.
- Legal Broadcast — SDI output is limited to legal broadcast.
- 3Ga->3Gb Conversion — (3G/6G/12G only) Enables or disables the output’s 3Ga-to-3Gb converter.
- RGB 3Ga Conversion — (3G/6G/12G only) Enables or disables the output’s RGB 3Ga converter.
- 3G Enabled — (3G/6G/12G only) Enables or disables 3G output. If disabled, the output is restricted to 1.5G.
- 3Gb Enabled — (3G/6G/12G only) Enables or disables 3Gb output.
- In the background area — Displays a context menu with commands that globally affect the device:
- Video Format — Pops up a sub-menu of video formats supported by the device. Choosing one of these formats globally changes the video format for all FrameStores on the device. Note that if the device is multi-format capable, choosing a format here will place the device into single-format (“uniformat”) mode before globally changing the video format.
- Pixel Format — Pops up a sub-menu of frame buffer pixel formats supported by the device. Choosing one of the formats globally changes the pixel format for all FrameStores on the device.
- 4K Mode — Available only if the device supports 4K/UHD video. If selected, pops up a sub-menu of 4K modes supported by the device:
- Tsi — Selects two-sample-interleave (per SMPTE 425-5).
- Squares — Selects the “quad” mode (aka “squares”).
- 8K Mode — Available only if the device supports 8K/UHD2 video. If selected, pops up a sub-menu of 8K modes supported by the device:
- Tsi — Selects two-sample-interleave (per SMPTE 425-5).
- Squares — Selects “quad-quad” mode.
- Clear Cables — Deletes all cable connections.
- Copy (Diagram) — Copies the diagram image to the clipboard.
- Copy (Source Code) — Copies the CNTV2Card::Connect calls that are needed to produce the current routing as C/C++ source to the clipboard.
- Paste Routing — Replaces the current routing with the routing determined by the encoded text from the clipboard.
- Load Preset — Reveals a submenu of stored presets. Choosing one will replace the current routing with the saved Preset routing.
- Delete Preset ‘name’ — Deletes the saved preset.
- Add Preset… — Prompts for a name under which to save the current routing configuration.
- Show All — Reveals all hidden widgets.
- Hide Unconnected — Hides all widgets that aren’t connected to anything else.
- Reset Positions — Reset the layout of all widgets back to their default positions.
- Drag & Drop
- For IDEs, text editors and word processors that support dragging/dropping text, the Routing Diagram panel will accept text data containing C++ code that contains CNTV2Card::Connect calls. If the dropped code parses correctly, whatever is stipulated by the code will replace the current routing. (NOTE: The parser is dirt-simple — it only works if the Connect function’s parameters are NTV2InputCrosspointID and NTV2OutputCrosspointID enums.)
Code Panel
The Code Panel shows the device’s current routing configuration in textual form.
- It does this in one of two ways:
- C++ Code — shows the SDK calls necessary to produce the routing configuration.
- Shorthand — shows the “shorthand” notation for it.
- The text panel is read-only — i.e., you can’t change what’s in it.
- It supports dragging text from it for dropping elsewhere (e.g. into a code editor window).
- Left-clicking allows text in the panel to be highlighted (selected) interactively with the mouse.
- Right-clicking pops up a context menu with these commands:
- Copy — Copies whatever text is highlighted in the panel to the host clipboard.
- Select All — Highlights all of the text in the panel.
- Other controls:
- Code Menu — Selects which encoding form to display.
- Presets Menu — Shows which preset matches the device’s current routing configuration (if any). Choosing one of the presets will replace the device’s current routing with the selected one.
- + Button — Click to define a new preset for the device’s current routing configuration.
- - Button — Click to delete the current routing preset.
Routing Registers Panel
The Registers Panel shows the device’s routing registers. To edit a register’s value, click in its value, change the value, then press Enter (or click elsewhere). If this causes a routing change, the diagram (and code panel) will reflect the change.
- Note
- The Routing Inspector has several preference settings in the Cables tab of the NTV2Watcher Preferences dialog.
“Fill Buffer” Tool
The “Fill Buffer” Tool is a handy debugging aid for filling device buffer memory with various values and/or patterns.
One or more frames can be written:
- Start Frame — Specifies the first frame to be written.
- End Frame — Determines the last frame to be written.
- All Frames — Check this to quickly select all frames on the device to be written.
There are currently three ways to fill buffer memory:
- Numeric Value — Fills one or more buffers with any 8, 16, 32 or 64-bit numeric value.
Click Apply to write the numeric value into the frame buffer(s). Checkboxes are provided for skipping certain regions of each frame buffer being filled:
- Field1 — Skips “Field 1” lines.
- Field2 — Skips “Field 2” lines.
- VANC — Skips VANC lines. (Enabled only when the FrameStore geometry is “tall” or “taller”.)
- Visible Raster — Skips the visible raster lines.
- Anc F1 Region — Skips the F1 Ancillary Data region.
- Anc F2 Region — Skips the F2 Ancillary Data region.
- Test Pattern — Fills one or more buffers with any of several predefined test patterns or colors.
The test pattern image is written to the buffer(s) immediately after selecting the test pattern or color.
- Color — Fills one or more buffers with any color chosen from a standard color picker.
The color raster is written immediately to the buffer(s) as the color is changed in the dialog.
- Text — Fills one or more buffers with glyphs rendered using the CNTV2CaptionRenderer class.
Note that the frame buffer(s) are written immediately after making any changes or selections in the panel.
- Display Text — A text edit box for specifying the text to be rendered.
- Blit Over Test Pattern — Renders the text after [re]writing the test pattern into the frame buffer(s).
- Y and X Position — Starting position where text rendering begins in the frame. The coordinate units depend on the Use Pixel Position checkbox.
- Use Pixel Position — Determines the position coordinate units where the text is rendered.
- Unchecked — use CEA608 row/column coordinates.
- Checked — use pixel offset from the top-left corner (where top-left is 0,0).
- Italic — Check the box to render in italics; un-check for non-italic (normal).
- Underline — Check the box to render with underline; un-check for no underline (normal).
- FG — Specifies the foreground color attribute.
- BG — Specifies the background color attribute.
- Opacity — Specifies the opacity attribute: Opaque, Translucent, or Transparent.
- Clear Caches — Clears the CNTV2CaptionRenderer caches.
“EIA/CEA-608 Caption” Tool
The EIA/CEA-608 Caption Tool is a handy debugging aid for viewing EIA-608 and/or CEA-608 caption byte-pair streams. It works with the Ancillary Data Inspector to supply its CEA-608 decoder with a stream of caption byte pairs to supply sufficient context in order to properly render captions. The tool window is dominated by two panels:
- Byte-Pair Stream — Displays a hexadecimal representation of the caption byte-pair stream being decoded.
- The text represents a byte-pair FIFO that holds up to 90 byte pairs (maximum):
- New byte pairs enter the FIFO at the bottom-right corner.
- The oldest byte pairs drop out of the FIFO at the top-left corner.
- When no caption data is being streamed, the text content can be edited:
- You can select all or part of the text, and copy it to the host’s clipboard.
- You can add, remove, or change its contents by typing, or by pasting text from the clipboard.
- The text must consist of 2-byte hexadecimal “words” separated by a single space (case is irrelevant). Any other format will fail to decode properly.
- The left-most 2 digits (most-significant byte) is “byte 1”;
- The right-most 2 digits (least-significant byte) is “byte 2”.
- Byte sequences from “.scc” sidecar files should work (but remove the timecodes).
- Example: Try the byte-pair sequence “
9425 94ad 9170 c845 cc4c 4f20” — it should render “Hello” for CC1.
- Decoded Captions — Renders the decoded captions, as they appear on-screen.
- The 608 decoder always re-decodes the entire FIFO whenever it changes, processing the byte pairs top-left to bottom-right.
- The last pair in the FIFO enters the decoder first;
- The first pair in the FIFO enters the decoder last.
A Channel selector menu is provided to change the caption channel being decoded and displayed:
- CC1 — the normal, primary (English language) closed-caption channel sourced from Field 1.
- CC2 — the secondary (often Spanish language) closed-caption channel, also sourced from Field 1.
- CC3, CC4 — additional closed-caption channels, sourced from Field 2.
- TX1, TX2 — text-only channels sourced from Field 1.
- TX3, TX4 — text-only channels sourced from Field 2.
- XDS is currently not available for decoding or display.
A Reset button is provided to manually reset the decoder, if necessary. Add or remove a space to/from it to force the decoder to re-render what’s in the byte stream.
To render captions in real-time, the decoder’s byte-pair FIFO requires a steady stream of caption byte-pairs transmitted by the Ancillary Data Inspector :
- “Analog” Captioning — All of the following are true:
- The monitored FrameStore/Channel is receiving or transmitting SD (U.S. NTSC 525i) video;
- The monitored FrameStore/Channel has a 'v210' or '2vuy' pixel format;
- The current frame buffer contains a valid “analog” caption byte pair encoded as a waveform per EIA-608 in “line 21” of active video.
- VANC Frame Geometry — All of the following are true:
- “Tall” or “Taller” VANC mode is enabled;
- The monitored FrameStore/Channel has a 'v210' or '2vuy' pixel format;
- If 8-bit YCbCr, VANC Shift Mode must be enabled;
- The VANC anc display is set to “Packets”;
- The packet display must contain:
- a CEA-708 packet that contains “Service 0“ CEA-608 caption data, or…
- at least one CEA-608 packet.
- Anc Extractor/Inserter F1 and/or F2 — All of the following are true:
- The monitored Anc Inserter/Extractor must be running;
- The Field 1 or Field 2 displays (or both) must be set to display “Packets”.
- One of the packet displays contains:
- a CEA-708 packet that contains “Service 0“ CEA-608 caption data, or…
- a CEA-608 packet.
- Note
- Successful caption rendering relies on getting a continuous byte pair sequence (no dropped frames). If the refresh rate of the Ancillary Data Inspector lags the frame rate, byte pairs will be skipped, resulting in garbled and unreadable captions. Hiding one or more of the Ancillary Data Inspector viewers (VANC, Anc Registers, F1, F2) can save CPU cycles and prevent lagging refresh rates.
To freeze the Byte-Pair Stream (perhaps to permit interacting with it manually), leave the Caption Viewer window open, but do one of the following:
Generating Captions
This tool can also generate caption byte pairs by using the controls at the bottom of the tool window:
- Type — This controls the type of caption to generate:
- Row spin control — specifies the row number where the caption text will appear.
- Col spin control — specifies the column number where the caption text will begin.
- FG — Specifies the foreground color of the caption text.
- BG — Specifies the background color of the caption text.
- Ital checkbox — If checked, the caption text should be italicized.
- Undr checkbox — If checked, the caption text should be underlined.
- Blnk checkbox — If checked, the caption text should blink.
- Transparency popup menu — Choose from Opaque, Translucent or Transparent.
- Text box — Enter the caption text to be generated.
- Click Xmit to generate and “transmit” the caption byte pairs. These will be DMA’d starting at the current frame’s F1 Anc or VANC region (in the Ancillary Data Inspector). It will continue pulling byte pairs from the FIFO and DMA’ing into subsequent frame buffers on the device.
To close the “CEA-608 Caption” Tool:
- click its close box;
- or un-check the View menu’s CEA608 Monitor command.
“Register Cycler” Tool
The “Register Cycler” is a handy tool for automatically cycling the value of a register from a minimum to a maximum numeric value at a particular step rate.
For example, it can be used to step an OutputFrame register to periodically cycle through several pre-loaded frame images.
Controls:
- Reg — Specifies the register to be cycled.
- Min — Specifies the minimum value for the register.
- Max — Specifies the maximum value for the register. When the register reaches this value, it will start over at the Min value.
- Rate slider — Adjusts the time between steps.
- Start — Starts the cycler running. When running, this button will be disabled and will be titled “Running”.
- Stop — Stops the cycler. When stopped, this button will be disabled and will be titled “Stopped”.
To close the Register Cycler:
- click its close box; or…
- un-check the View menu’s Register Cycler command.
“Tone Generator” Tool
The Tone Generator is a handy tool for generating one or more channels of audio tones.
Controls:
- Function — For each audio channel, determines if the audio channel is enabled or not, and if enabled, the waveform signal that will fill the channel.
- Off — Disables the channel, and produces silence (zero values).
- Sine — Produces sinusoidal waveform.
- Trian — Produces a triangle waveform.
- Square — Produces a square waveform.
- Noise — Produces pseudo-random noise.
- For enabled channels, additional controls are available:
- Frequency — Adjusts the frequency of the generated waveform (not available for Noise). For finer-grained control, click on the control, then adjust it using your keyboardʼs arrow keys.
- Phase — Adjusts the phase (time shift) of the generated waveform (not available for Noise).
- Amplitude — Adjusts the amplitude of the generated waveform.
- Offset — Adjusts the (amplitude) offset of the generated waveform (like adding a DC component to it).
- Duty Cycle — Adjusts the duty cycle (for Square or Triangle waveforms only).
- Audio System popup menu — Specifies the target Audio System whose buffer will receive the generated audio samples. Choosing a new Audio System will automatically stop the generator (if running).
- Fill — Generates samples and fills the given Audio System’s entire output buffer in a one-shot operation.
- Start — Starts the generator to run continuously. When running, this button will be disabled and will be titled “Running”.
- Stop — Stops the generator. When stopped, this button will be disabled and will be titled “Stopped”.
To close the Tone Generator tool window:
- click its close box; or…
- un-check the View menu’s Tone Generator command.
“Memory Map” Tool
The Memory Map is a handy debugging aid for visualizing how device memory is being used. It can readily indicate When FrameStores Access the Same Frame Buffer Memory and/or Audio Buffer Corruption.
- The top of the window has two indicators:
- Intrinsic Frame Size — indicates the “natural” size of a non-4K, non-8K frame, in megabytes. This is what the hardware is using for normal, non-4K/8K frames.
- Total SDRAM — displays the total SDRAM complement of the device, in megabytes.
- The remainder of the window contains the Memory Map:
- The horizontal space represents the device’s addressable SDRAM storage:
- Address zero (0x00000000) is at the far left edge;
- The highest addressable byte is at the far right edge.
- The vertical space is irrelevant.
- Scrolling — When needed, scroll bars are provided to allow scrolling offscreen areas of the Map into view.
- Zoom Controls — Click + to zoom in; click − to zoom out.
- Memory Region objects:
- Frame — The gray boxes represent the intrinsic 8MB or 16MB frame boundaries.
- The numeric labels show the zero-based frame number.
- Each frame represents a specific, unique byte range in device memory. No two frames ever overlap.
- The width indicates the device’s Intrinsic Frame Size. At this time, NTV2 devices use an intrinsic frame size of either 8MB or 16MB.
- Double-click to open the Frame Buffer Inspector and view the raw frame data.
- Right-click for a context menu:
- AutoCirculate — These translucent boxes span multiple Frames, and represents the frames being used by an AutoCirculate channel.
- Color depends on the Channel video format: green for SD, purple for HD, etc.
- Label identifies the Mode and Channel (e.g. “In1”, “Out2”, etc.).
- When in Quad Mode (4K/UHD) or Quad-Quad Mode (8K/UHD2), the logical frame size is 4 or 16 times (respectively) the device’s intrinsic frame size.
- Double-click to open the AutoCirculate Inspector.
- Right-click for a context menu:
- Inspect — opens the AutoCirculate Inspector.
- Stop — stops the channel.
- Pause — pauses the channel.
- Resume — resumes the channel.
- Drag to change the channel’s frame range (it will be restarted).
- Video Read — (Green) — Represents the “Output Frame” being read by an enabled FrameStore.
- Labeled with the FrameStore’s channel number (e.g. “1”, “2”, etc.).
- In memory, NTV2 FrameStore widgets (see FrameStore Operation ) always read video starting at the frame boundary (at the lowest address).
- The width of the box indicates how much memory is being read by the FrameStore.
- Double-click to open the Frame Buffer Inspector and view the frame image.
- Right-click for a context menu:
- Inspect — opens the Frame Buffer Inspector to view the frame image.
- Disable — disables (turns off) the FrameStore.
- Drag to interactively change the FrameStore’s “Output Frame”.
- Video Write — (Red) — Represents the “Input Frame” being written by an enabled FrameStore.
- Labeled with the FrameStore’s channel number (e.g. “1”, “2”, etc.).
- In memory, NTV2 FrameStore widgets (see FrameStore Operation ) always write video starting at the frame boundary (at the lowest address).
- The width of the box indicates how much memory is being written by the FrameStore.
- Double-click to open the Frame Buffer Inspector and view the frame image.
- Right-click for a context menu:
- Inspect — opens the Frame Buffer Inspector to view the frame image.
- Disable — disables (turns off) the FrameStore.
- Drag to interactively change the FrameStore’s “Input Frame”.
- Audio Read — (Green) — Represents the playout audio buffer being read during Audio Playout .
- Labeled with the Audio System (e.g. “A1”, “A2”, etc.).
- Double-click to open the Audio Inspector and reveal the audio buffer’s contents.
- Right-click for a context menu:
- Inspect — opens the Audio Inspector to reveal the audio buffer’s contents.
- Stop Playback — stops the audio system’s playback engine.
- Audio Write — (Red) — Represents the capture audio buffer being written during Audio Capture .
- Labeled with the Audio System (e.g. “A1”, “A2”, etc.).
- Double-click to open the Audio Inspector and reveal the audio buffer’s contents.
- Right-click for a context menu:
- Inspect — opens the Audio Inspector to reveal the audio buffer’s contents.
- Stop Recording — stops the audio system’s record/capture engine.
- Conflict — (Red) — A bright red bar over one or more Frames that indicates a conflict — i.e. the frame memory is being used by more than one entity (e.g. being read and/or written by more than one FrameStore and/or Audio System), which can result in garbled video and/or audio. See When FrameStores Access the Same Frame Buffer Memory for more information.
- You can hover the mouse pointer over any object to display a tooltip that contains detailed information about the region.
To close the Memory Map tool window:
- click its close box;
- or un-check the View menu’s Memory Map command.
“Scrap Buffer” Tool
The Scrap Buffer is a handy debugging aid for viewing data buffers, including the contents of the host operating system’s “desk scrap” buffer (aka “clipboard” or “paste buffer”). It also displays the contents of files or text clippings dropped into the window.
- Each buffer is represented by a tab in the window.
- The Clipboard tab is monitored and automatically udpates as it changes. (Files, however, are not monitored.)
- The window title indicates the data set, its byte count, and if it’s been modified.
- Left-click the tab title to reveal its data content, bringing it to the front.
- Right-click inside the tab content for a context menu.
- Data Editing:
- Undo — Un-does the last operation that was done.
- Redo — Re-does the last undone operation.
- Cut — Copies the selected data to the clipboard/scrap buffer, then removes it.
- Copy — Copies the selected data to the clipboard/scrap buffer.
- Paste — Pastes the clipboard/scrap data over the selected data, or, if there’s nothing selected, inserts the data at the right-click location.
- Clear — Removes the selected data.
- Select All — Selects (highlights) all data.
- Data View Options:
- Grouping — Changes the data grouping to 8-bit (1-byte), 16-bit (2-byte), 32-bit (4-byte) or 64-bit (8-byte).
- Radix — Changes the radix of the data to Binary, Octal, Decimal or Hexadecimal.
- Bytes/Line — Changes the number of bytes to display in each line of the data view. Choose from 8 bytes up to 8K bytes by powers of 2. Note that larger values make for fewer lines and many more columns. Smaller values show many more lines with fewer columns.
- Endianness — Changes the display byte-ordering for 2/4/8-byte grouping. Choose “Big Endian” or “Little Endian”. One of the two options will indicate the host processor’s native endianness.
- Show Rulers — When available, shows whichever rulers were previously hidden.
- Show/Hide ASCII — Reveals or hides a side panel that displays the same row data as printable ASCII.
- Row & Column Label Options — (Right-Click Operations)
- Reference — Choose “Byte Offset From Start” or “Byte Offset From End”.
- Radix — Choose “Binary”, “Octal”, “Decimal” or “Hexadecimal”.
- Hide — Hides the ruler. (To show the ruler again, right-click in the data and choose “Show Rulers”.
- Right-click the tab title to pop-up a context menu of File Operations:
- New (Dupe) — Duplicates the tab content in another new tab.
- Open… — Brings up a file picker dialog box for choosing a data file to open a new tab on.
- Close — Requests the tab be closed. If there are unsaved changes, you’ll be asked if you wish to save them or not.
- Compare — Compares the tab contents with another tab’s contents, highlighting the differences with a brighter color.
- Revert — Prompts if changes should be discarded and the tab content reloaded from the file as saved on disk.
- Save — Writes the tab contents to the file on disk.
- Save As… — Brings up the standard Save As… dialog box for choosing the name of a file to be written with the tab data content.
- Page Setup… — Brings up the standard Print Setup… dialog box for choosing the print page layout.
- Print… — Brings up the standard Print… dialog box for printing the tab data content.
To close the Scrap Buffer tool window:
- click its close box;
- or un-check the View menu’s Scrap Buffer command.
- If there are unsaved changes in any of the open tabs, you’ll be given an opportunity to save them all, discard them all, or cancel the close request.
“SDK Demos” Tool
The SDK Demos tool makes it easy to quickly configure and run SDK demo programs directly from NTV2Watcher without having to use an external command-line Terminal or remember option parameter names.
The Configure tab is the first tab, is always present, and is where demo apps are configured and started. It has no close box … and thus cannot be closed.
To close the SDK Demos tool window:
- click its close box;
- or un-check the View menu’s SDK Demos command.
- Starting a demo
- From the Demo: menu, choose the demo to run.
- Note
- If the Run button (in the bottom-right corner) is dimmed (disabled), the demo executable could not be found in folders (or sub-folders) starting in the folder that contains NTV2Watcher.
- The Parameters and Options section will re-populate with those options and parameters supported by the chosen demo.
- Make any option choices and parameter selections as desired. The Command Line will automatically update as option choices and parameter selections change.
- Click Run to start the demo. A new tab will be created to show the status of the running demo.
- Monitoring the running demo
- Each running demo is represented by a separate tab.
- The tab title indicates which demo app was (or is still) running.
- Hovering over the tab title pops up a tooltip that shows the full path to the demo executable file.
- Left-click the tab title to bring its content to the front.
- Right-click the tab title to pop-up a context menu:
- Close — Closes the tab. If its corresponding SDK demo is running, it will be terminated.
- Save… — Choose this to open a standard Save As… dialog box for choosing the name and location of a text file to be filled with the demo’s output text.
- Terminate — Choose this to terminate the running demo.
- The cyan-colored text at the top shows the command line that was (or is still) running. The text panel below it indicates the execution status:
- completed normally (green) indicates the demo ran and completed without errors.
- running (yellow) indicates the demo is still running.
- terminated abnormally with exit code (red) indicates the demo terminated with a non-zero exit code.
- Click Stop to terminate the running demo.
- Click Re-Run to re-run the completed (or terminated) demo.
- Note
- Closing the SDK Demos window closes all demo tabs, and thus terminate any running demos.
“AJADebug Stats” Tool
The AJADebug Stats tool monitors active AJADebugStat instances.
- The very top of the window shows the version number and size of the AJADebug facility’s shared memory buffer. It also shows the number of active AJADebugStat instances (and the maximum number of stats that the shared buffer can accommodate).
- The window can be resized, and the monitored AJADebugStat instances will automatically “reflow” to fit within the given window dimensions.
- Right-click in the window to pop-up its context menu:
- Named Stats — Pops up a sub-menu of known stats that can be monitored. Selecting a named stat adds it to those being monitored in the window.
- Show Details — Expands all monitored AJADebugStat instances to show all their information (max, min, count, average, etc.).
- Hide Details — Shrinks all monitored AJADebugStat instances to only show the minimum information.
- Reset All — Resets all monitored AJADebugStat instances (such that their max, min and moving average computations are restarted).
- Right-click in a monitored AJADebugStat instance to pop-up its context menu:
- Min — If checked, displays the smallest value ever seen for the stat (since last reset).
- Max — If checked, displays the largest value ever seen for the stat (since last reset).
- Count — If checked, displays the number of times the stat value was updated.
- Timestamp — If checked, displays the host operating system timestamp when the stat value was last updated.
- Value — If checked, displays the latest (instantaneous) value.
- Avg — If checked, displays the moving average value.
- Format — Pops up a sub-menu for changing the display format of the stat value as Decimal (base 10), Hex (base 16), and Float (in floating-point).
- Designated Timer — If checked, declares the stat to be a timer, which displays its data as timing measurements. If not checked, declares the stat to NOT be a timer, which displays its data as simple numeric values.
- Delete — Stops monitoring the AJADebugStat instance, removing it from the stats being displayed.
To close the SDK Demos tool window:
- click its close box;
- or un-check the View menu’s AJADebug Stats command.
“AJADebug Log” Tool
The AJADebug Log tool allows you to monitor, in near real time, log messages originated by the AJADebug facility. It has several handy features:
- Filtering based on message content.
- Filter based on message classification and/or severity.
- Colorize messages based on originating process ID.
- Calculate time between two messages.
- Log recording, snapshotting, copying (clipboard) and printing.
The user interface consists of the AJA Debug Log window that has three parts:
- A button bar at the top that allows you to configure what is seen (or not seen) in the main view;
- The main view containing the log display with column headings;
- A status bar at the bottom that shows logging activity statistics.
To close the AJADebug Log tool window:
- click its close box;
- or un-check the View menu’s AJADebug Log command.
- Operation
The Main View shows log messages in tabular fashion, one log entry per row, with the log entry data shown in columns. The tool bar at the top has the following controls:
- Message Groups…: Click to open the Enable/Disable Message Groups dialog:
- Log to File: Enables or disables recording incoming messages to a log file.
- Save…: Saves the contents of the message display to a file of the user’s choosing.
- Font…: Opens a font dialog to change the font and size of the log display.
- Clear: Erases all captured messages from the log display.
- AutoScroll: Enables or disables the auto-scrolling feature.
- Pause: Pauses or resumes the capture/display of new messages.
- Add Marker: Inserts a marker into the log.
- Auto Group: Specifies a “quiet time”, in seconds, that if no messages are logged in that interval, the first that arrives after it transpires will automatically be preceded by a marker entry.
- Message Filter: If non-empty, filters the log display such that it will only show messages containing the filter text.
The data columns are as follows:
- Index: The unique index number of the message. This number starts at zero when the AJA Debug Facility is initialized.
- PID: The ID of the message’s originating host process.
- TID: The ID of the message’s originating host thread.
- Time: The host timestamp when the message entered the AJA Debug Facility’s ring buffer.
- Group: The message’s classification group (see AJADebugUnit).
- Severity: The message’s severity (see AJADebugSeverity).
- Source: The message’s originating source file name and line number (if known).
- Message: The log message text.
By default, all columns are visible. If needed, any of the columns (except for Message) can be hidden.
- To hide a column, uncheck it in the View menu’s Column sub-menu.
- To re-show a column, check it.
- To quickly re-show all columns, choose the Show All Columns command in the Column submenu in the View menu.
Messages are always displayed in increasing index/time order, top-to-bottom.
The Status Bar shows:
- File Recording State: If the logger’s “Log” setting is enabled, it shows the path of the log file being written, and its size, in bytes. If the logger’s “Log” setting is off, it shows “not logging to file”.
- Message Stats:
- Ignored: The number of messages that were reported by AJADebug clients, but ignored by the AJA Logger. You can choose the kinds of messages to ignore by showing the Enables dialog box by clicking the Enables button. You can also pause the logger by clicking the Pause button.
- Accepted: The number of messages that were reported by AJADebug clients, and accepted for display by the AJA Logger application.
- Total: The total number of messages that were reported by AJADebug clients.
- Ref Count: The number of attached clients that are currently monitoring AJADebug activity.
As new messages are reported to the AJADebug logging facility, these are detected and, if configured to show them, incorporated into the log display. If AutoScroll is enabled, the display will auto-scroll to the bottom, to continually show the newest message.
- Note
- Log messages containing line breaks (newline characters) are displayed in a single row, with the message text truncated at the first line break in the message with an ellipsis (‘…’). If logging to a file, the message text is written to the log file unchanged (including line breaks).
- Selecting and Copying Data
Clicking inside the Main View highlights (selects) information on a per-messsage (row) basis. The usual rules of selection are followed:
- “Shift-click” — Extends the selection.
- “Ctrl-click” or “Command-click” — Extends or contracts the selection.
- “Dragging” — Continues to extend (or contract) the selection while the mouse button is down (and auto-scrolls, too).
Right-clicking inside the Main View pops up a context menu:
- Set row color for PID… —
- Copy — Copies selected log entries to the host’s clipboard.
- Clear — Clears the entire log display.
- Select All — Selects (highlights) all captured log entries.
- Columns — Chooses which columns (fields) are shown.
- Index — If checked, shows the log message sequence (index) number.
- PID — If checked, shows the originating process IDs.
- TID — If checked, shows the originating thread IDs.
- Time — If checked, shows the timestamp when the message was received.
- Group — If checked, shows the message group.
- Severity — If checked, shows the message severity.
- Source — If checked, shows the originating source file name.
- Show All Columns — Choose this item to enable all columns (fields).
- Grid — If checked, displays a grid between columns and rows.
- AutoScroll or Stop AutoScroll — Choose this item to enable or disable auto-scrolling.
- Auto-Resize Columns — Choose this item to toggle column auto-resizing.
- Font… — Choose this item to choose a different display font and/or size.
- Message Groups… — Choose this item to open the Enable/Disable Message Groups Dialog.
- Add Marker — Choose this item to insert a marker into the log.
- Pause or Resume — Choose this item to pause or resume the capture and display of new incoming log messages.
- Log to File — Choose this item to start or stop the capture of incoming log message to a local host file.
- Text Delimiter — Choose this item to pop up a sub-menu to choose a different column delimiter.
- Page Setup… — Choose this item to pop up the Page Setup dialog.
- Print… — Choose this item to bring up the Print dialog to print the captured log.
- Reset Ref Count — Choose this item to reset the AJADebug facility’s reference counter.
- Logging to a File
To toggle the automatic recording of incoming messages into a file on the host:
- Click the Log to File button;
- or choose Log to File in the context menu.
When enabled:
- The path to the file (and its current size, in bytes) is displayed in the Status Bar, on the left side.
- The file is written in clear text, in UTF-8 encoding, one line per message.
- The line delimiter used is native to the host operating system.
- The field delimiter is user-selectable, and defaults to the semicolon (“;”).
- To change it, choose the Text Delimiter command in the context menu … then choose the desired delimiter (semicolon, colon, comma, space, or tab).
- Subsequent writes to the file will use the new delimiter.
- Log messages that contain line breaks in the message text are written into the log file without change.
To toggle file logging on or off, click the Log to File button in the Toolbar, or un-check its command in the Action menu.
- Clearing the Log Display
To clear the log display, do one of the following:
- click the Clear button;
- or choose Clear from the context menu;
- or press the forward-delete key.
- Pausing or Resuming the Log Display
To pause the capture and display of new incoming messages:
- click the Pause button;
- or choose Pause in the context menu.
Even if paused, new messages are still recorded in the log file (if file logging is enabled).
To resume capture and display of new messages:
- click the Resume button;
- or choose Resume in the context menu.
- Inserting Markers Into the Log
An “elapsed time” marker is automatically inserted into the log when a new log message is captured after a user-configurable number of seconds has passed since the last accepted message was received. The default time interval is 86400 seconds (one day). To change time interval, type a new value, in seconds, into the Auto Group edit box … then press Return, Enter or Tab.
To manually insert a marker into the log, click the Add Marker button. It will be timestamped and appended to the log.
- Changing the Display Font/Typeface
To change the typeface used in the log display, click the Font… button or the Font… command in the context menu. The host-specific Font-chooser dialog box will appear. Choose the font family, size and style, then click OK. The Main View will be redrawn using the new typeface.
- Changing the Message Color Based on Process ID
AJADebug Log can display messages having the same process ID (PID) with a chosen background color, making it easy to differentiate messages coming from different processes on the host computer.
- Right-click on the message(s) having the desired process ID you wish to colorize.
- Choose Set row color for PID….
- A color picker dialog will appear. Choose the new desired background color, then click OK.
All messages having that process ID will be drawn with the newly-chosen background color.
- Resizing Columns
AJADebug Log can automatically adjust its column widths based on the widest data in the column. When the Auto-Resize Columns item in the context menu is checked, columns will automatically resize based on the captured messages being displayed. If the item is unchecked, column widths are fixed. Choose the Auto-Resize Columns item to toggle its setting.
To manually resize a column, click on the column’s border in the column heading, and drag.
- Filtering Displayed Messages
To see only those messages that contain a particular character string, enter the search text into the Message Filter edit box … then press Return, Enter or Tab. Henceforth, you’ll only see messages that contain that text — all others will be excluded and invisible.
- Note
- This will only affect messages received by AJA Logger after changing the Message Filter text.
To stop filtering displayed messages, delete all text from the Message Filter edit box … then press Return, Enter or Tab.
- Measuring the Time Between Two Messages
To measure the time span between two messages in the display:
- Click the Stop AutoScroll button. This makes it easier to select the desired message.
- Scroll to reveal the first message, then (left) click on it.
- Scroll to reveal the second message, then Command-Click (MacOS) or Control-Click on it.
- Right-click on either of the two highlighted messages.
- Note the elapsed “Time Difference” is the first item in the popup menu.
Enable/Disable Message Groups Dialog
AJADebug Tool has powerful filtering capabilities that make it easy to “include everything except…” or “exclude everything but…” or a combination.
To reveal the Enable/Disable Message Groups dialog box:
- click the Message Groups… button;
- or choose the Message Groups… command from the context menu.
The dialog box has two sections:
- Groups — Enable or disable message display by group (aka AJADebugUnit).
- Severity — Enable or disable message display by severity (aka AJADebugSeverity).
Each checkbox is “live” — i.e. toggling a checkbox takes effect immediately.
There are handy pushbuttons for immediately enabling or disabling all of the Group or Severity checkboxes.
Click OK to dismiss (hide) the dialog box.
How to Post Messages
SDK clients can post their own messages with the AJADebug facility.
- In your source file(s),
#include "ajadebug.h" .
- Be sure to link with the libajantv2 library.
- When the application starts, call AJADebug::Open.
- Call AJADebug::Report to log a message … or use one of the AJA_sDEBUG, AJA_sINFO, AJA_sNOTICE, etc. macros.
NTV2Watcher Preferences
The Preferences dialog is opened by choosing the “Preferences…” menu command, which is located…
- MacOS: under the “NTV2Watcher” application menu
- Windows and Linux: under the “Help” menu
Changing any setting stores the new setting, and it takes effect immediately.
General Preferences
The controls in this panel set general (global) preferences for the NTV2Watcher application.
- Pre-Lock Host Buffers — When checked, pre-locks host DMA buffers (which can improve performance).
Color Preferences
The controls in this panel set the color preferences for several inspectors that display numeric data.
- Generic — For generic video data, sets the colors used for “unchanged” and “changed” video data.
- Ancillary — For ancillary data, sets the colors used for “unchanged” and “changed” ancillary data.
- Audio — For audio data, sets the colors used for “unchanged” and “changed” audio data.
Cables Preferences
The controls in this panel set the preferences for the Routing Inspector.
- Allow drag & drop to/from disabled sockets — When checked, allows dragging new connection cables to or from disabled sockets.
- FrameStore Preview — When hovering the mouse over a FrameStore widget, you can see previews of the image stored in its current frame buffer.
- Off — Disables the Preview feature.
- Adjacent — Put the preview next to the FrameStore widget.
- In bottom-left corner — Put the preview in the bottom-left corner of the Cables view.
- Animate signals in cables — When checked, cables that are actively carrying a signal will display with an animation effect.
‘supportlog’ Command-Line Utility
- Description
A command-line tool that generates a support log file that contains state information about the device and driver for one or more AJA devices, and can optionally capture device SDRAM contents into a separate binary dump file.
- Synopsis
supportlog [OPTION...]
-d, --device=index#|serial#|model device to use
-s, --stdout dump to stdout instead of file?
-r, --sdram also dump device SDRAM to .raw file?
-v --verbose verbose mode?
-w --wait=seconds time to wait before capturing
--version show version and exit
Help options:
-?, --help Show this help message
--usage Show brief usage message
- The executable is shipped pre-built with the SDK, and appears in the “bin” directory.
- Source code is provided in the Linux SDK.
- Device Selection
By default, supportlog generates a support log for the first device found.
This is no different than specifying device zero:
$ ./bin/supportlog --device 0
You can also specify a device by model name. For example, if a Kona4 was installed in the host system:
$ ./bin/supportlog --device kona4
You can also specify a device by serial number:
$ ./bin/supportlog --device 00T12345
- Log Files
Files are always written into the currently logged-in user’s home directory:
$ ls ~/*log
-rw-r--r-- 1 demo staff 130K Sep 20 15:53 /Users/demo/aja_supportlog_0_1537484005.log
-rw-r--r-- 1 demo staff 226K Sep 20 15:53 /Users/demo/aja_supportlog_1_1537484005.log
-rw-r--r-- 1 demo staff 272K Sep 20 15:53 /Users/demo/aja_supportlog_2_1537484005.log
The name of the log file contains the device index number, and a 10-digit number that’s based on the date and time it was generated. If the host file system enumerates files lexically by name, within a single device index’s group, they should appear sorted oldest-to-newest.
To write a log file to a specific directory with a different name, use the “–stdout” option along with standard shell redirection directives to pipe the output into the desired file and path:
$ ./bin/supportlog --stdout >./my_support_log.txt
- Delaying Log Capture
Sometimes it’s desirable to capture the log after a certain length of time, often to give the operator time to change something. Use the “–wait” option to specify a delay time. For example, to capture a log after delaying 10 seconds:
$ ./bin/supportlog --wait 10
- Capturing Device SDRAM Contents
If AJA SDK Support requests a snapshot of the device’s SDRAM contents, use the “–sdram” option.
- Note
- The resulting dump file will be quite large. Be sure the host storage volume on which your home directory resides has plenty of free space.
“AJA System Test”
This page describes how to use the AJA System Test utility to measure the read/write performance of an AJA device and/or local host disk storage.
- General Operation
The user interface consists of a single main window, with…
- Write and Read progress indicators featured prominently in the middle.
- The big, green Start button, which starts a test running. When a test is running, it becomes a large, red Stop button.
- Operation Mode buttons (at the top). These are mutually exclusive — only one mode can be active at any given time.
- Settings (on the left). These allow you to choose resolution, file size, codec type, device, target disk, etc.
- A graph icon (at the bottom) to toggle the display of performance charts.
The Settings panel (on the left) makes it easy to both see and change the relevant test settings. Click on the heading to change the setting.
- Resolution — Selects the video format (and frame dimensions) of interest. (For device tests, the available formats may vary depending on the selected device capabilities.)
- Test File Size — Selects the size of the test file to be created and used in the test. Choose from 256MB to 16GB.
- Codec Type — Selects the codec type to be used in the test. Choose from a variety of uncompressed YUV or RGB formats, and many compressed formats.
- Target Disk — Selects the host disk volume to be used for the test.
- Note
- The volume must be writable and have sufficient free space to accommodate the test file(s) that the test will create.
- Pixel Format — Selects a pixel format. The available formats will vary, depending on the selected device capabilities.
- AJA Device — Selects an AJA device to test.
- Settings — Used to configure other lesser-used settings (see below).
System Disk Test
The System Disk Test measures the read/write performance of local host storage.
To measure disk performance for a particular local host volume…
- Choose a video Resolution.
- Choose a Test File Size.
- Choose a Codec Type.
- Choose a Target Disk.
- Click Start.
- Click the MB/Sec button to view the performance as a data rate, in megabytes per second.
- Click the F/Sec button to view the performance as a frame rate, in frames per second.
- Click the graph icon at the bottom to reveal charts of the read/write performance over time.
AJA Device Test
The AJA Device Test measures the hostʼs-deviceʼs DMA read/write performance.
To measure DMA performance for a particular device…
- Choose a video Resolution.
- Choose a Pixel Format.
- Choose a device.
- Click Start.
- Click the MB/Sec button to view the performance as a data rate, in megabytes per second.
- Click the F/Sec button to view the performance as a frame rate, in frames per second.
- Click the graph icon at the bottom to reveal charts of the read/write performance over time.
Disk + Device Test
The Disk + Device Test measures more “real-world” read/write performance by performing DMA reads followed by host disk writes (for capture), and host disk reads followed by DMA writes (for playout).
To measure combined DMA and host disk I/O performance…
- Choose a video Resolution.
- Choose a Test File Size.
- Choose a Codec Type.
- Choose a Target Disk.
- Choose a Pixel Format.
- Choose an AJA Device.
- Click Start.
- Click the MB/Sec button to view the performance as a data rate, in megabytes per second.
- Click the F/Sec button to view the performance as a frame rate, in frames per second.
- Click the graph icon at the bottom to reveal charts of the read/write performance over time.
Other Settings
The “Settings” dialog box is used to configure other lesser-used settings.
- Start Test — Configures whether the test runs once (the default) or continuously.
- Disk Test — Configures the Disk Test to create and use one “File per Frame” or use one “Single file” for all frames. Defaults to “Single file”.
- Disk Cache — Enables or disables the local host operating systemʼs disk cache. Defaults to “Disable”.
- Disk Mode — Configures the Disk Test to measure “Read/Write”, “Write-only” or “Read-only (write once)” performance. Defaults to “Read/Write”.
- DMA Mode — Configures the Device Test to use one (“Single Engine”) or two (“Dual Engines”) DMA engines. Defaults to “Dual Engines”.
System Report
The System Report shows detailed information about the host system and the attached AJA device(s) that may affect read/write performance.
To export a .pdf file that contains the report…
- Be sure the Generate System Report File (.spx) checkbox is unchecked (clear).
- Click Save.
- A folder-picker dialog box will appear. Choose a folder in which to save the PDF file, then click Open.
To export a .spx file that contains the full report of the host system configuration…
- Be sure the Generate System Report File (.spx) checkbox is checked (ticked).
- Click Save.
- A folder-picker dialog box will appear. Choose a folder in which to save the SPX file, then click Open.
To copy all or part of the report text out of the report window…
- Left-click and drag through the text in the window, or right-click and choose Select All (or press Ctrl-A).
- Right-click and choose Copy (or press Ctrl-C).
- You may now paste (using Ctrl-V) the copied text into a document being edited in another running application.

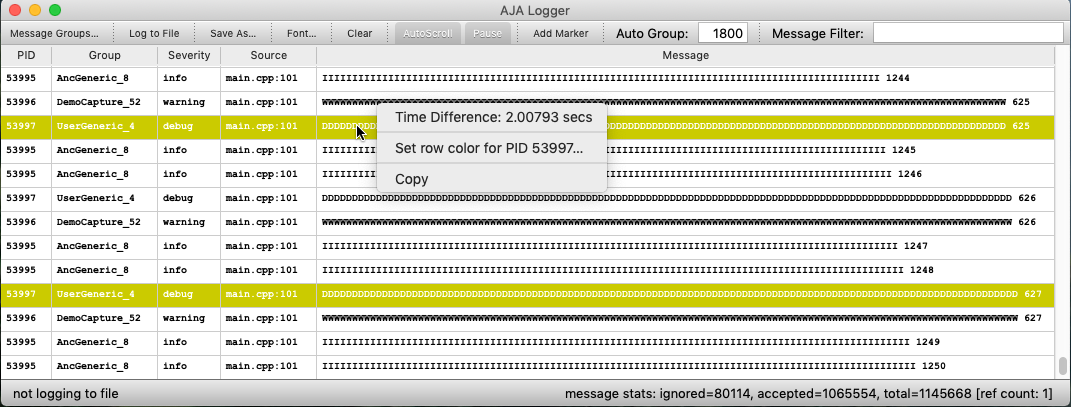
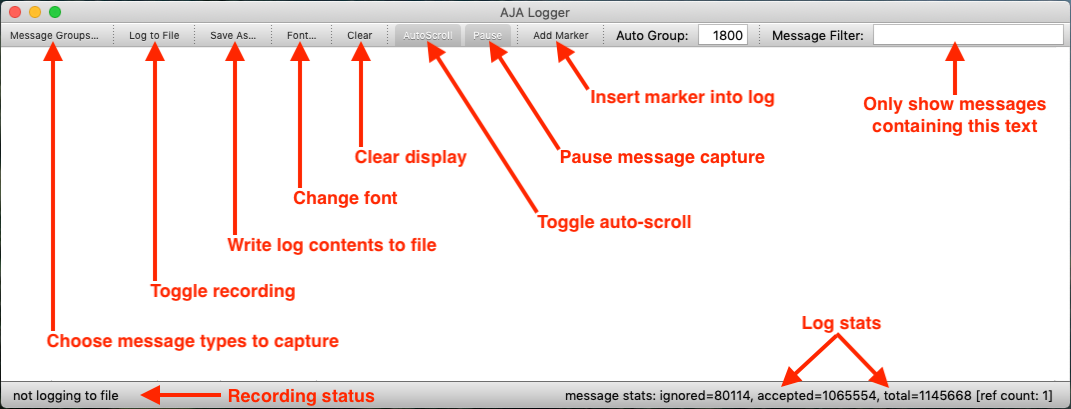
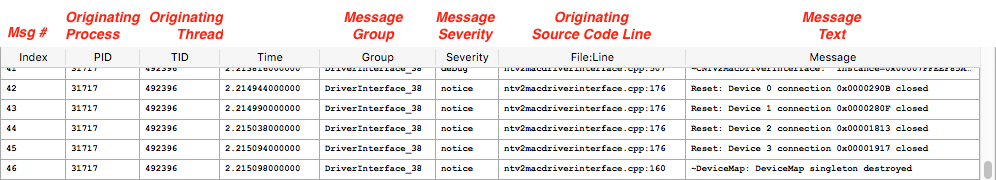
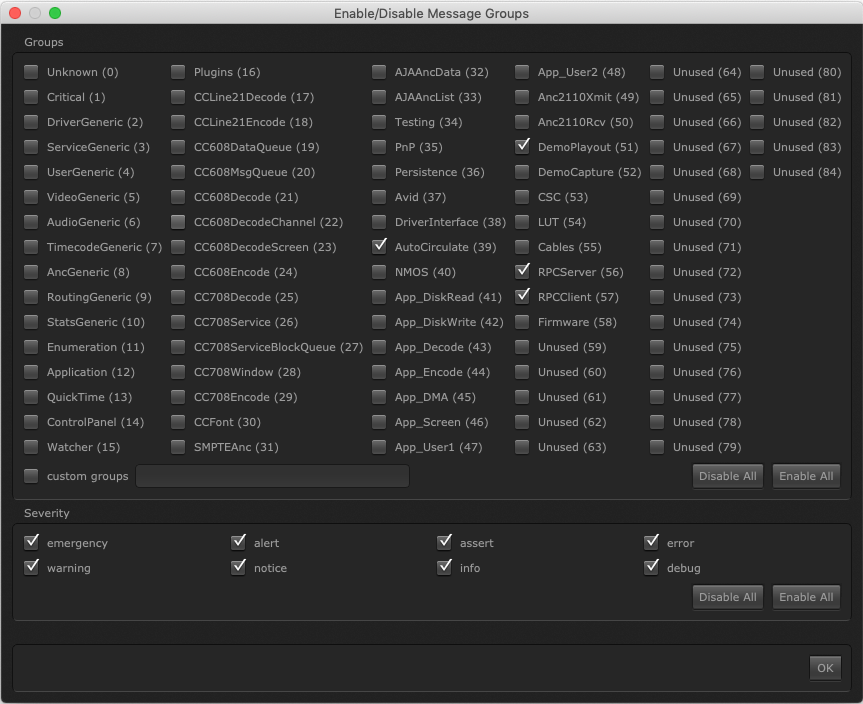
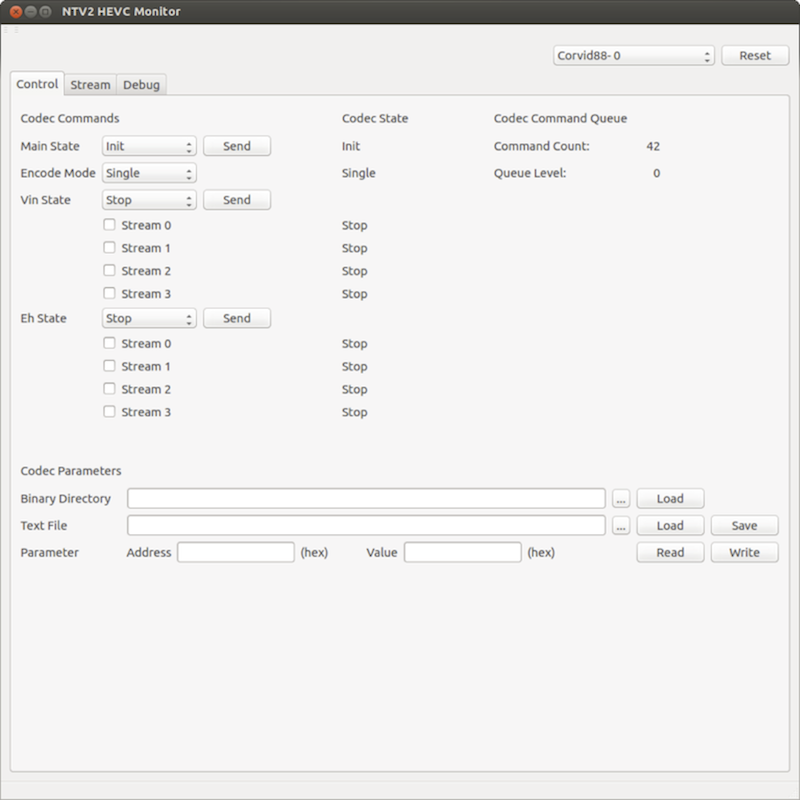
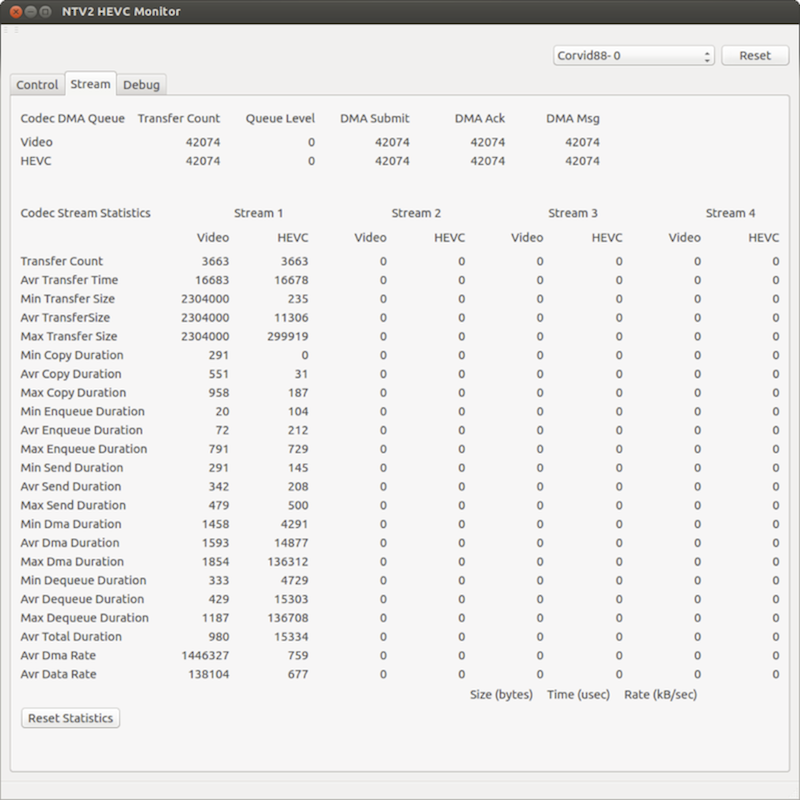
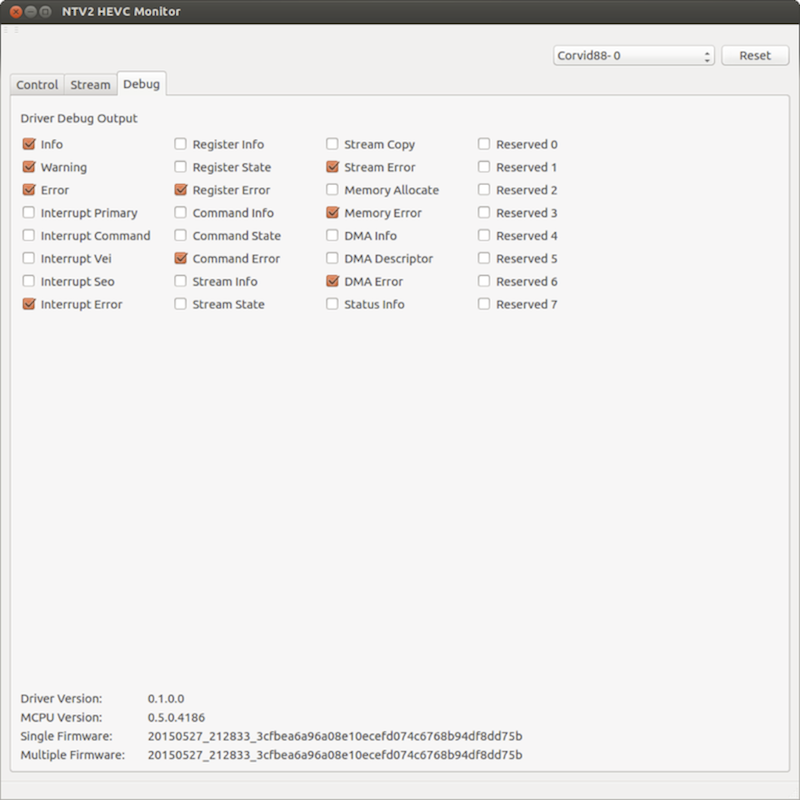
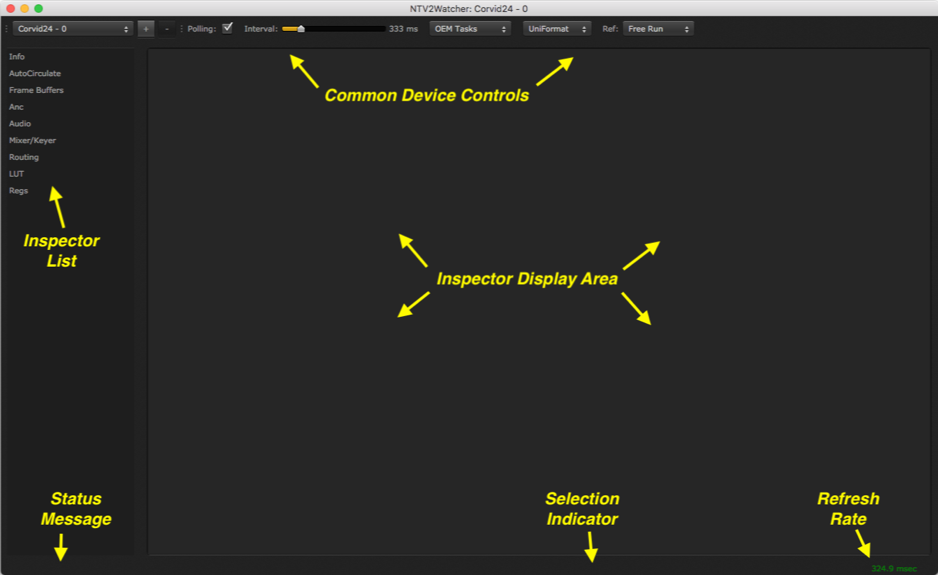
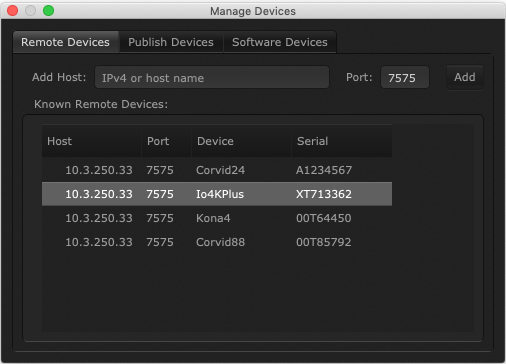

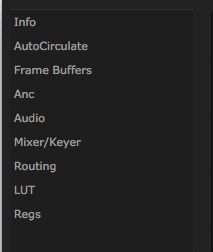
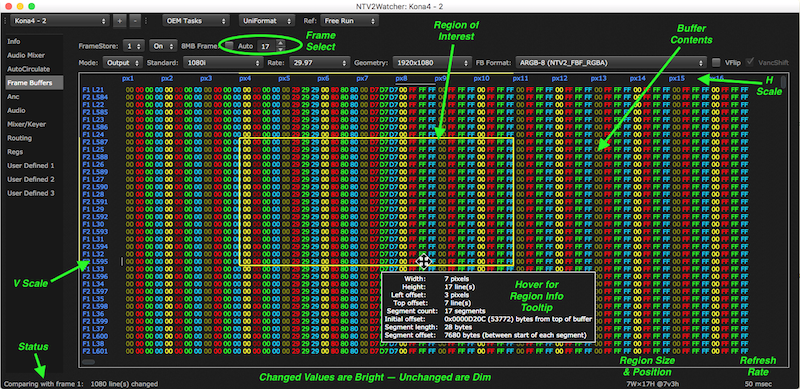
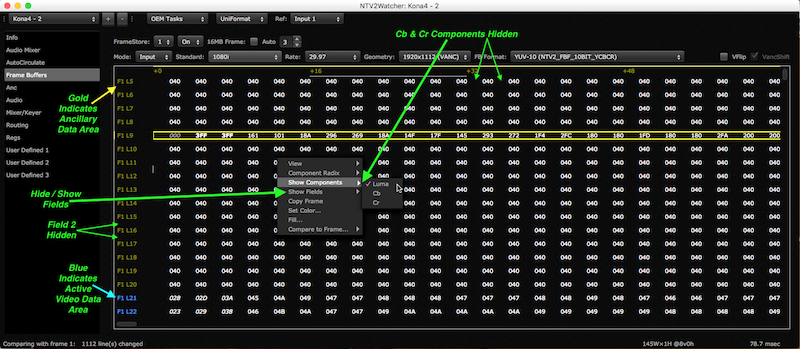
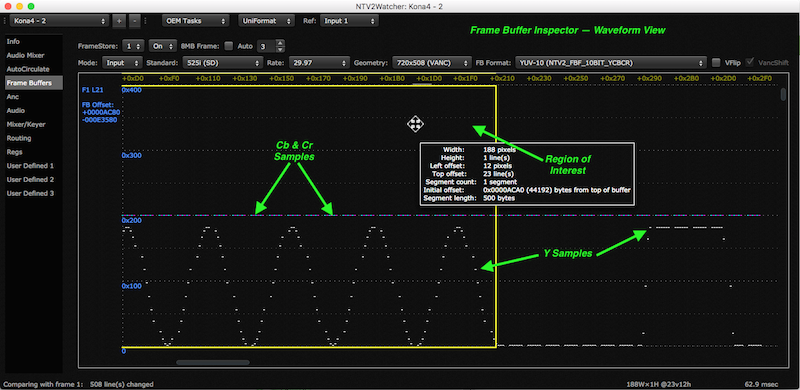
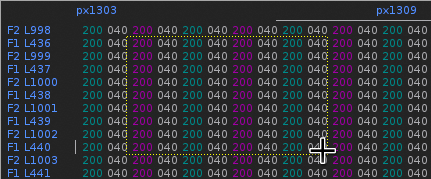
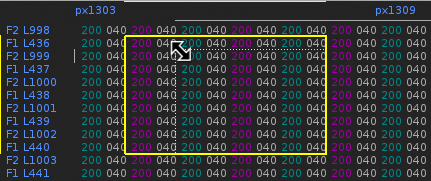
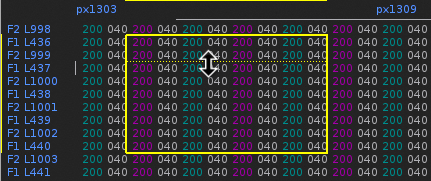
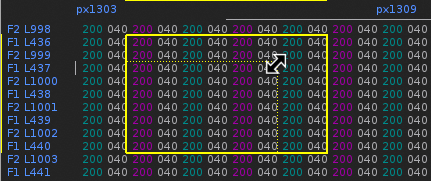
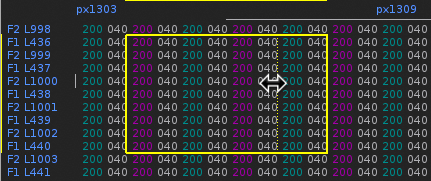
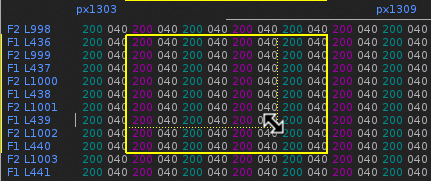
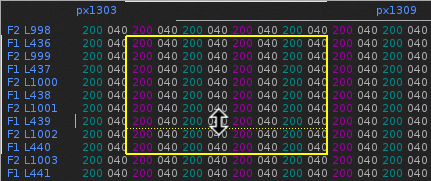
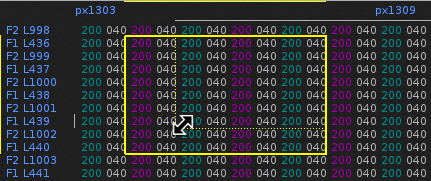
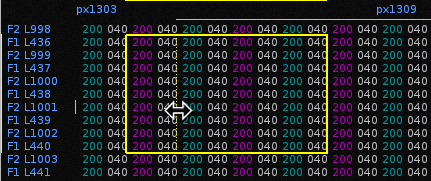
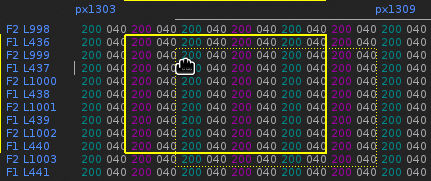
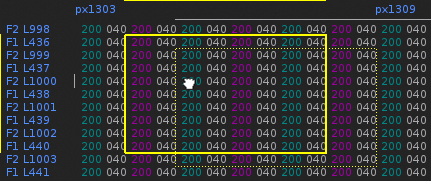
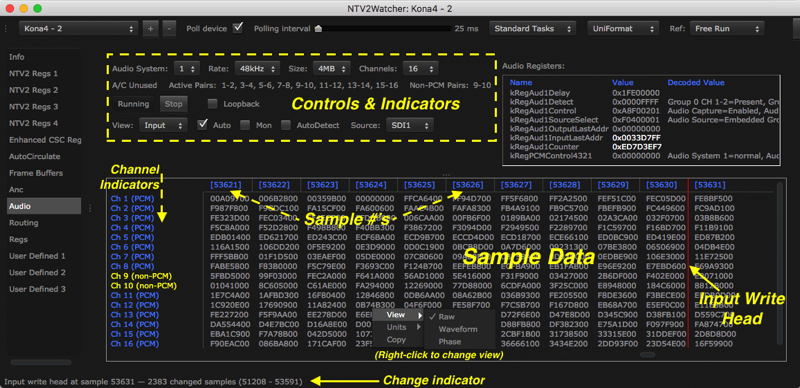
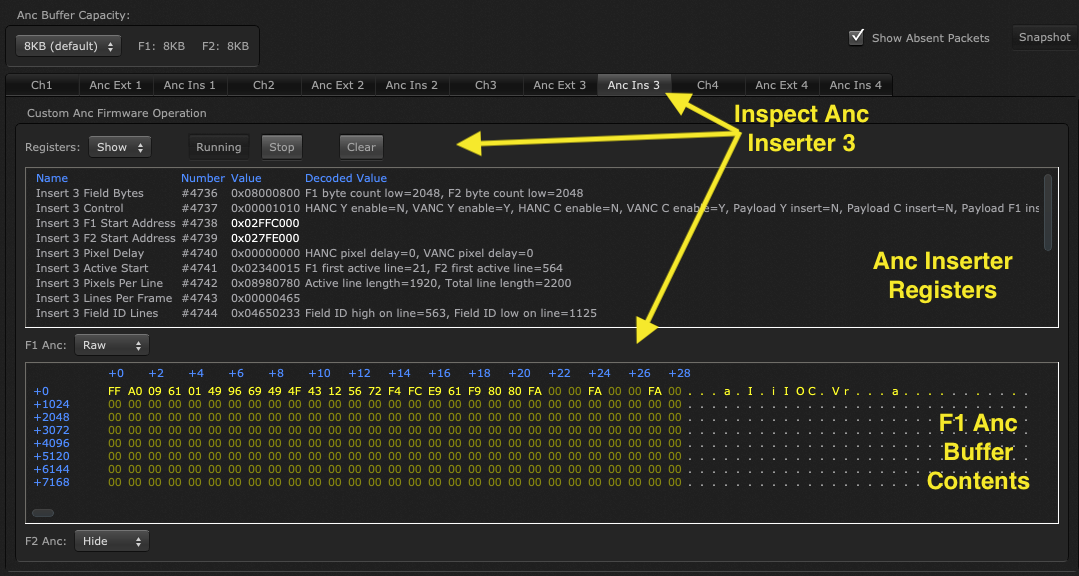

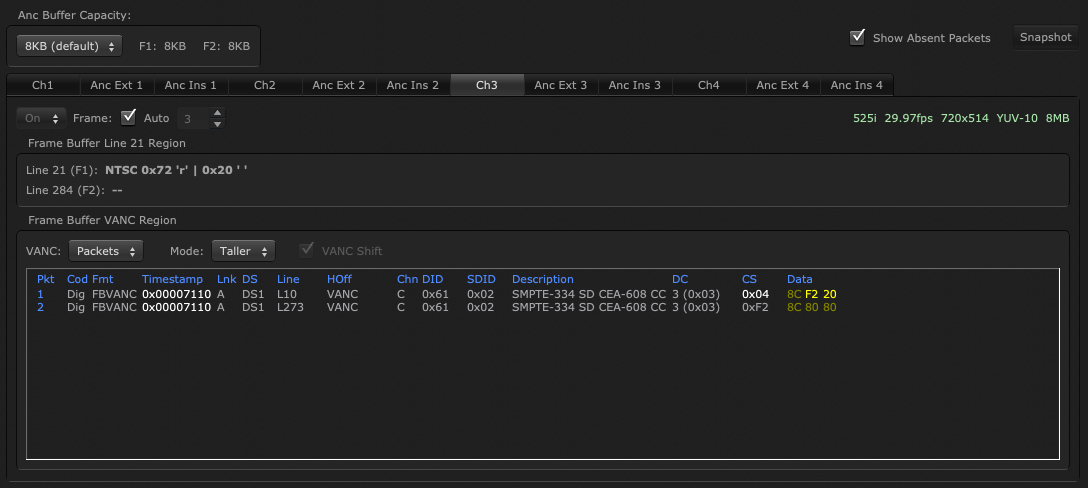
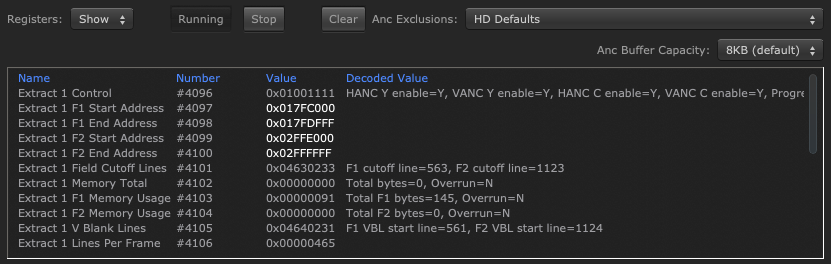
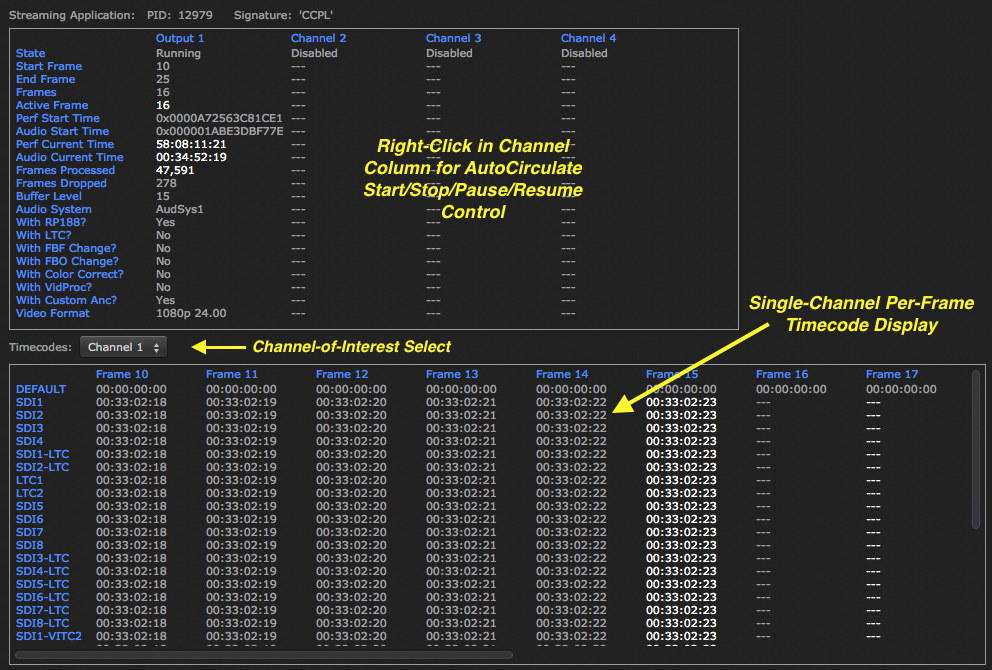
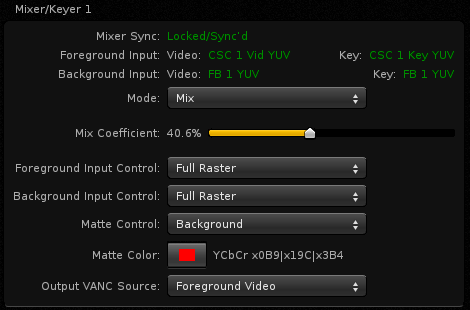
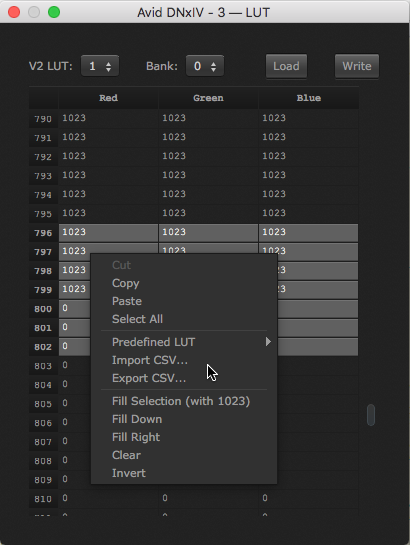
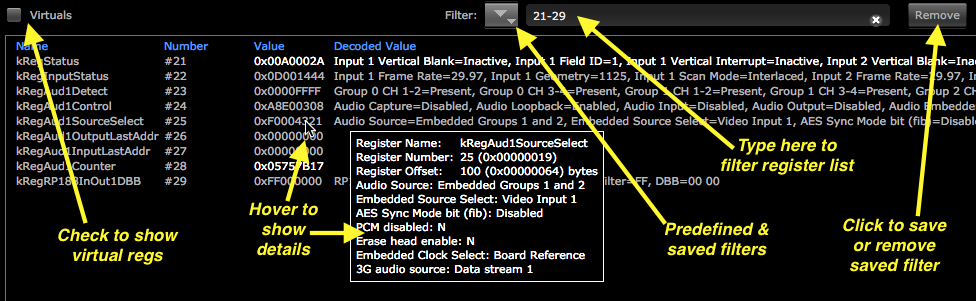
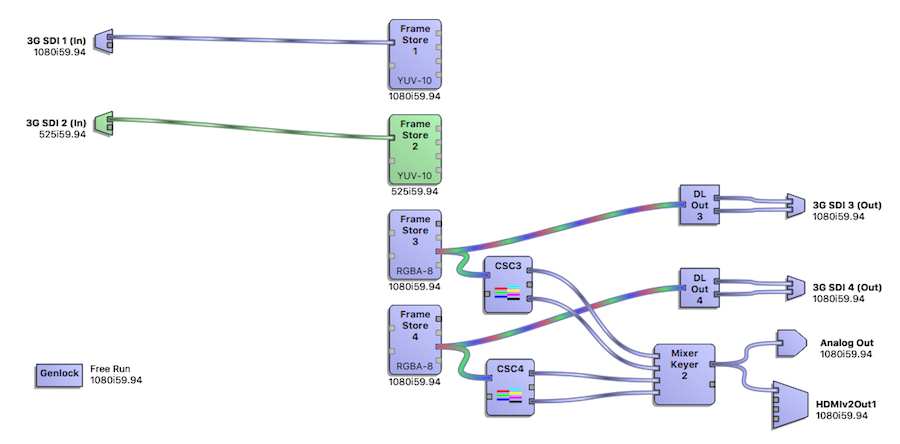
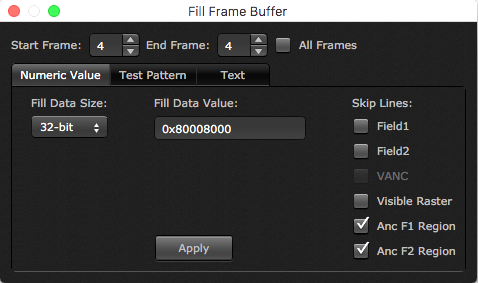
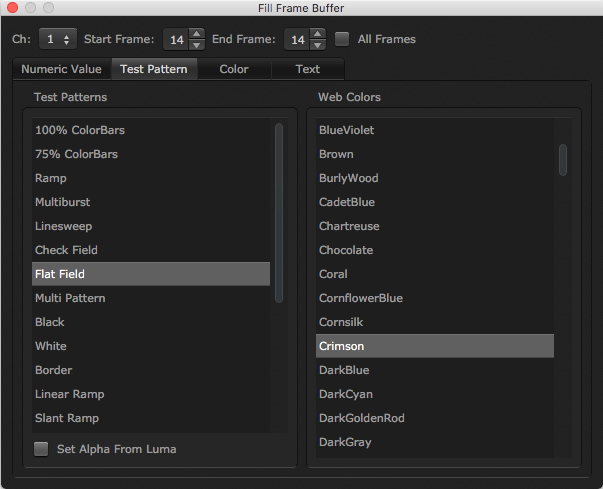
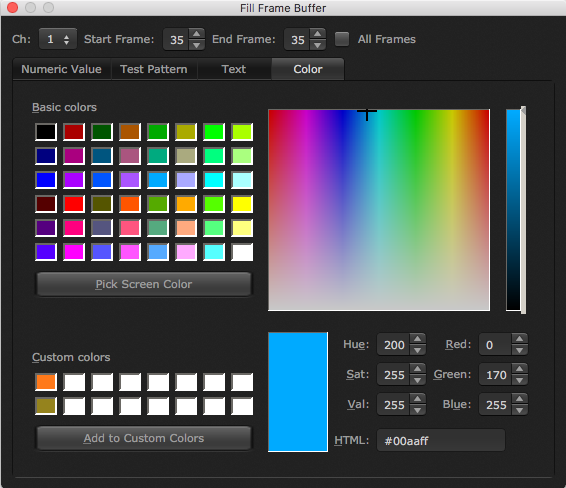
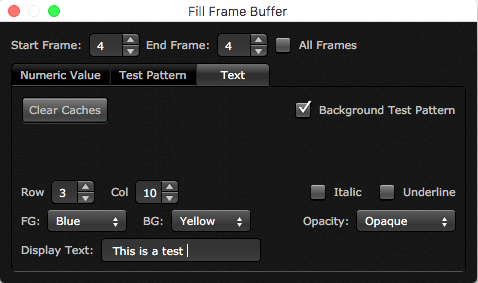
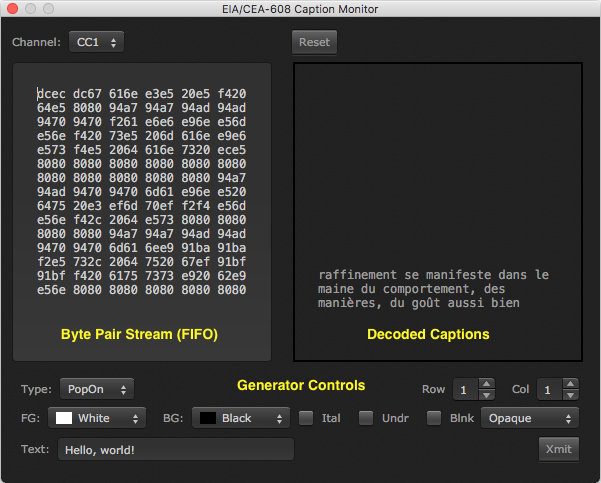
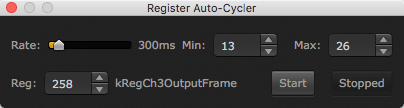
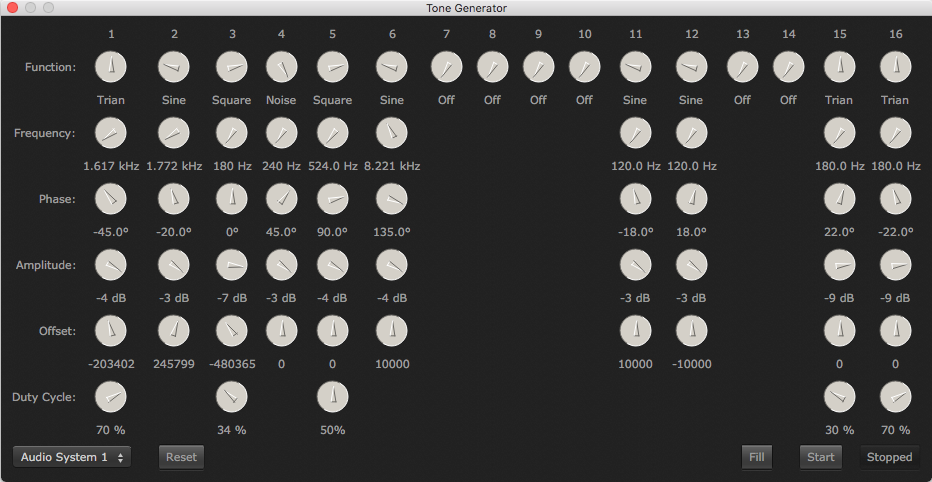

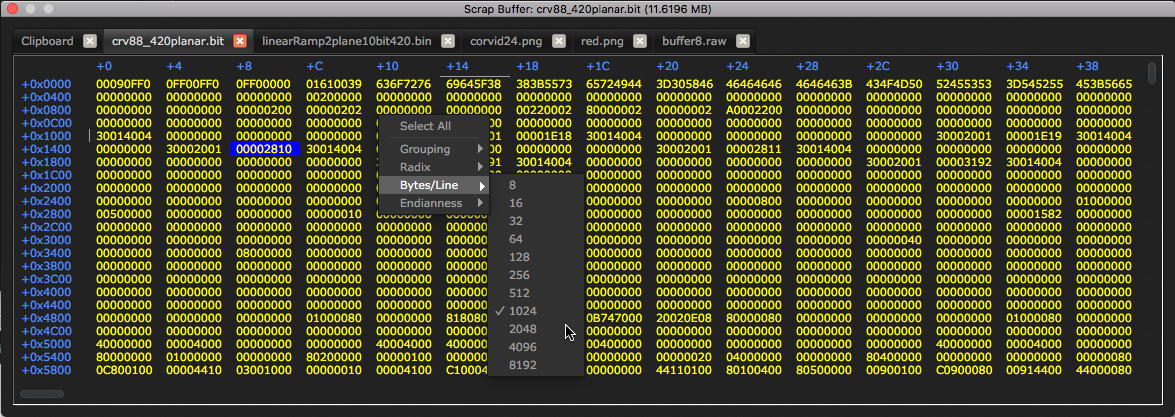
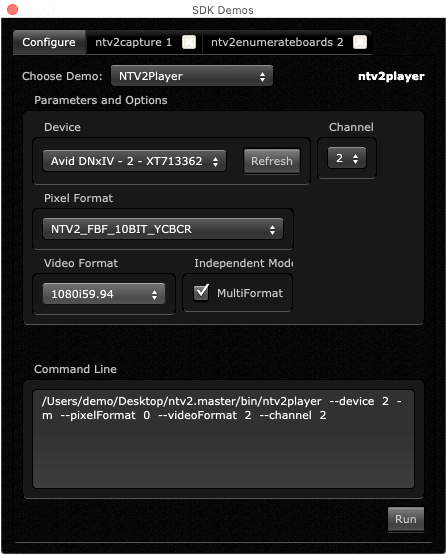
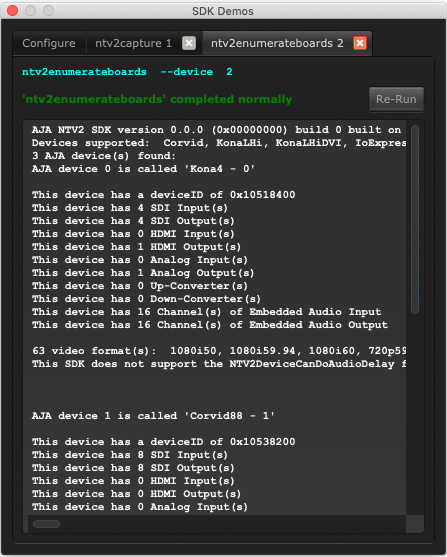
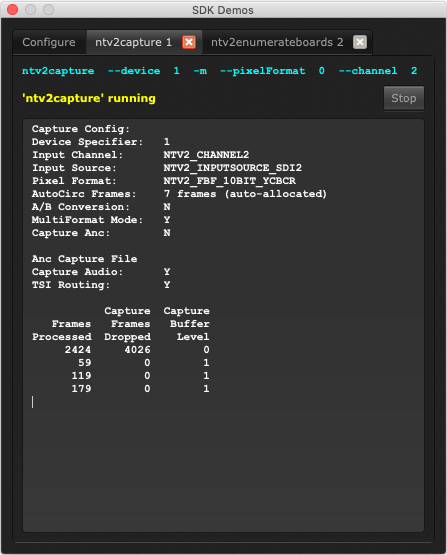
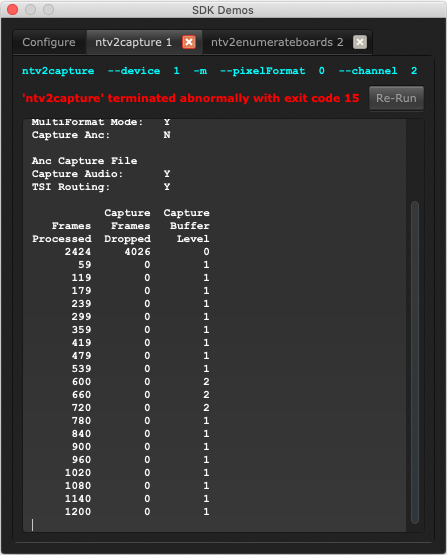
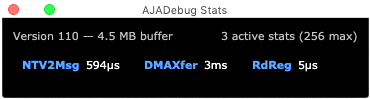
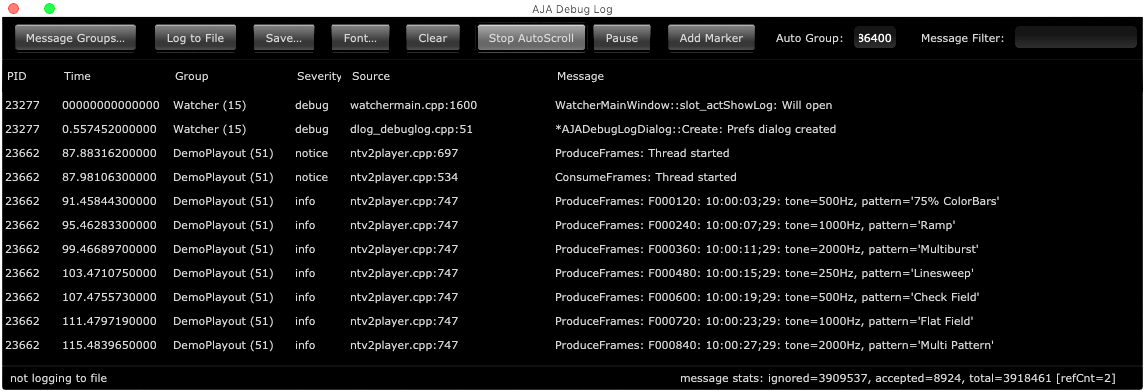
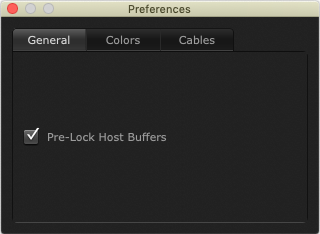
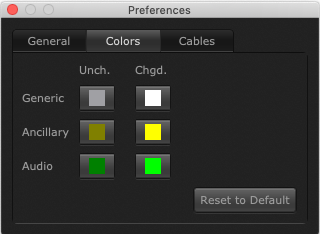
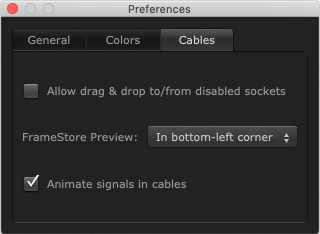
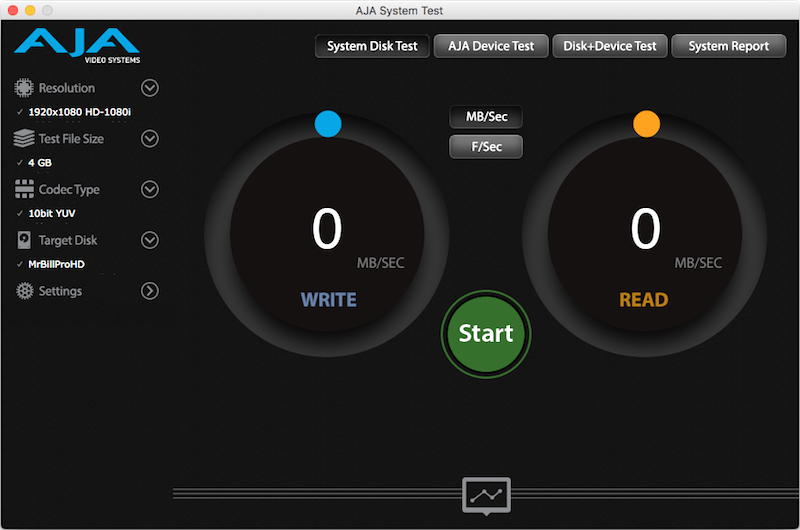
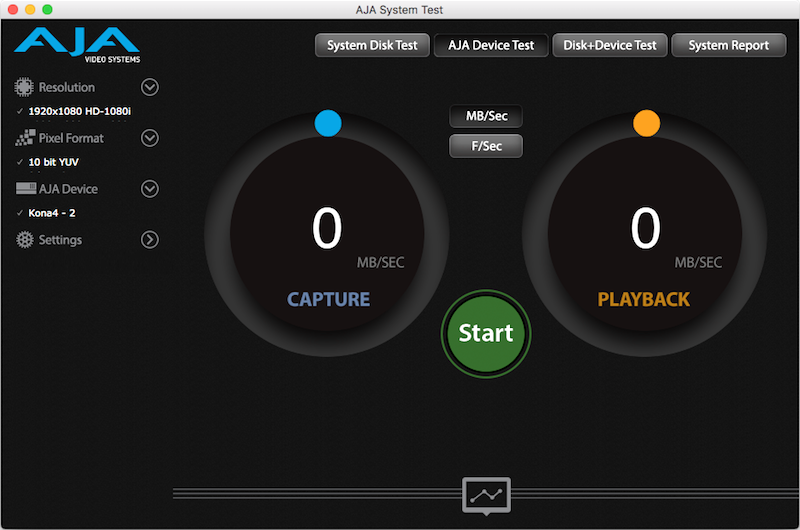
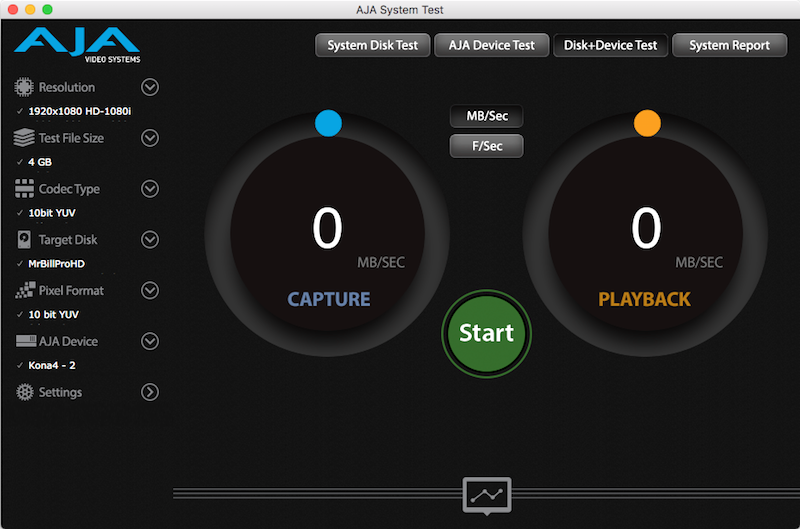
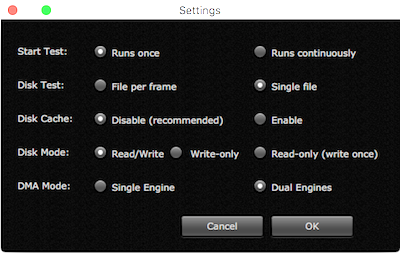
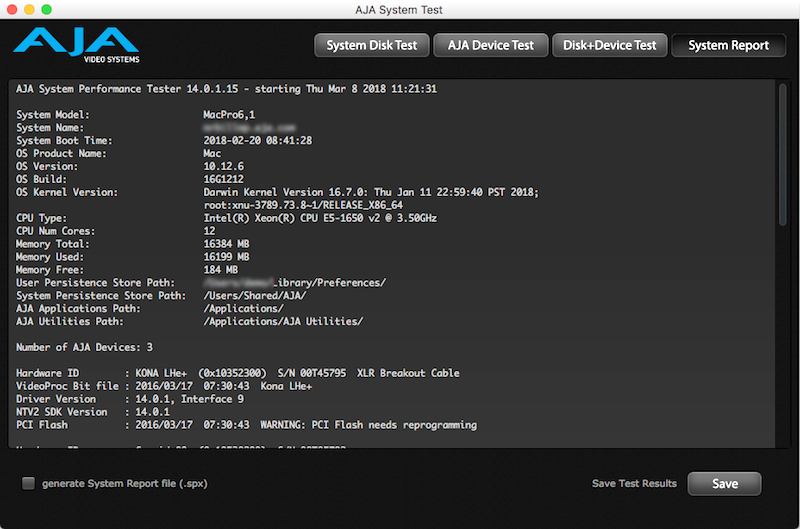
 1.8.17